To start, we need to get the relevant parameters for the cytometer. This tells AutoSpectral a lot about what you’re doing. In this example, we’ll use data from the Cytek Aurora.
asp <- get.autospectral.param(cytometer = "aurora", figures = TRUE)Create a folder containing only the single-stained control FCS files describe the path to that folder here.
control.dir <- "~/AutoSpectral_data/Aurora_example/Aurora_controls"With this information, we can create a draft of the control file. More detail on this will be included in a separate article.
create.control.file(control.dir, asp)For now, we’ll use the pre-filled control file, which you can get from Mendeley Data at https://data.mendeley.com/datasets/xzt3h3gnx9/1
control.file <- "~/AutoSpectral_data/Aurora_example/aurora_fcs_control_file.csv"Now we are ready to read in the fcs files, gate the cells and organize the experiment.
flow.control <- define.flow.control(control.dir, control.file, asp)Check the gating plots.
CD8 T cell gating: 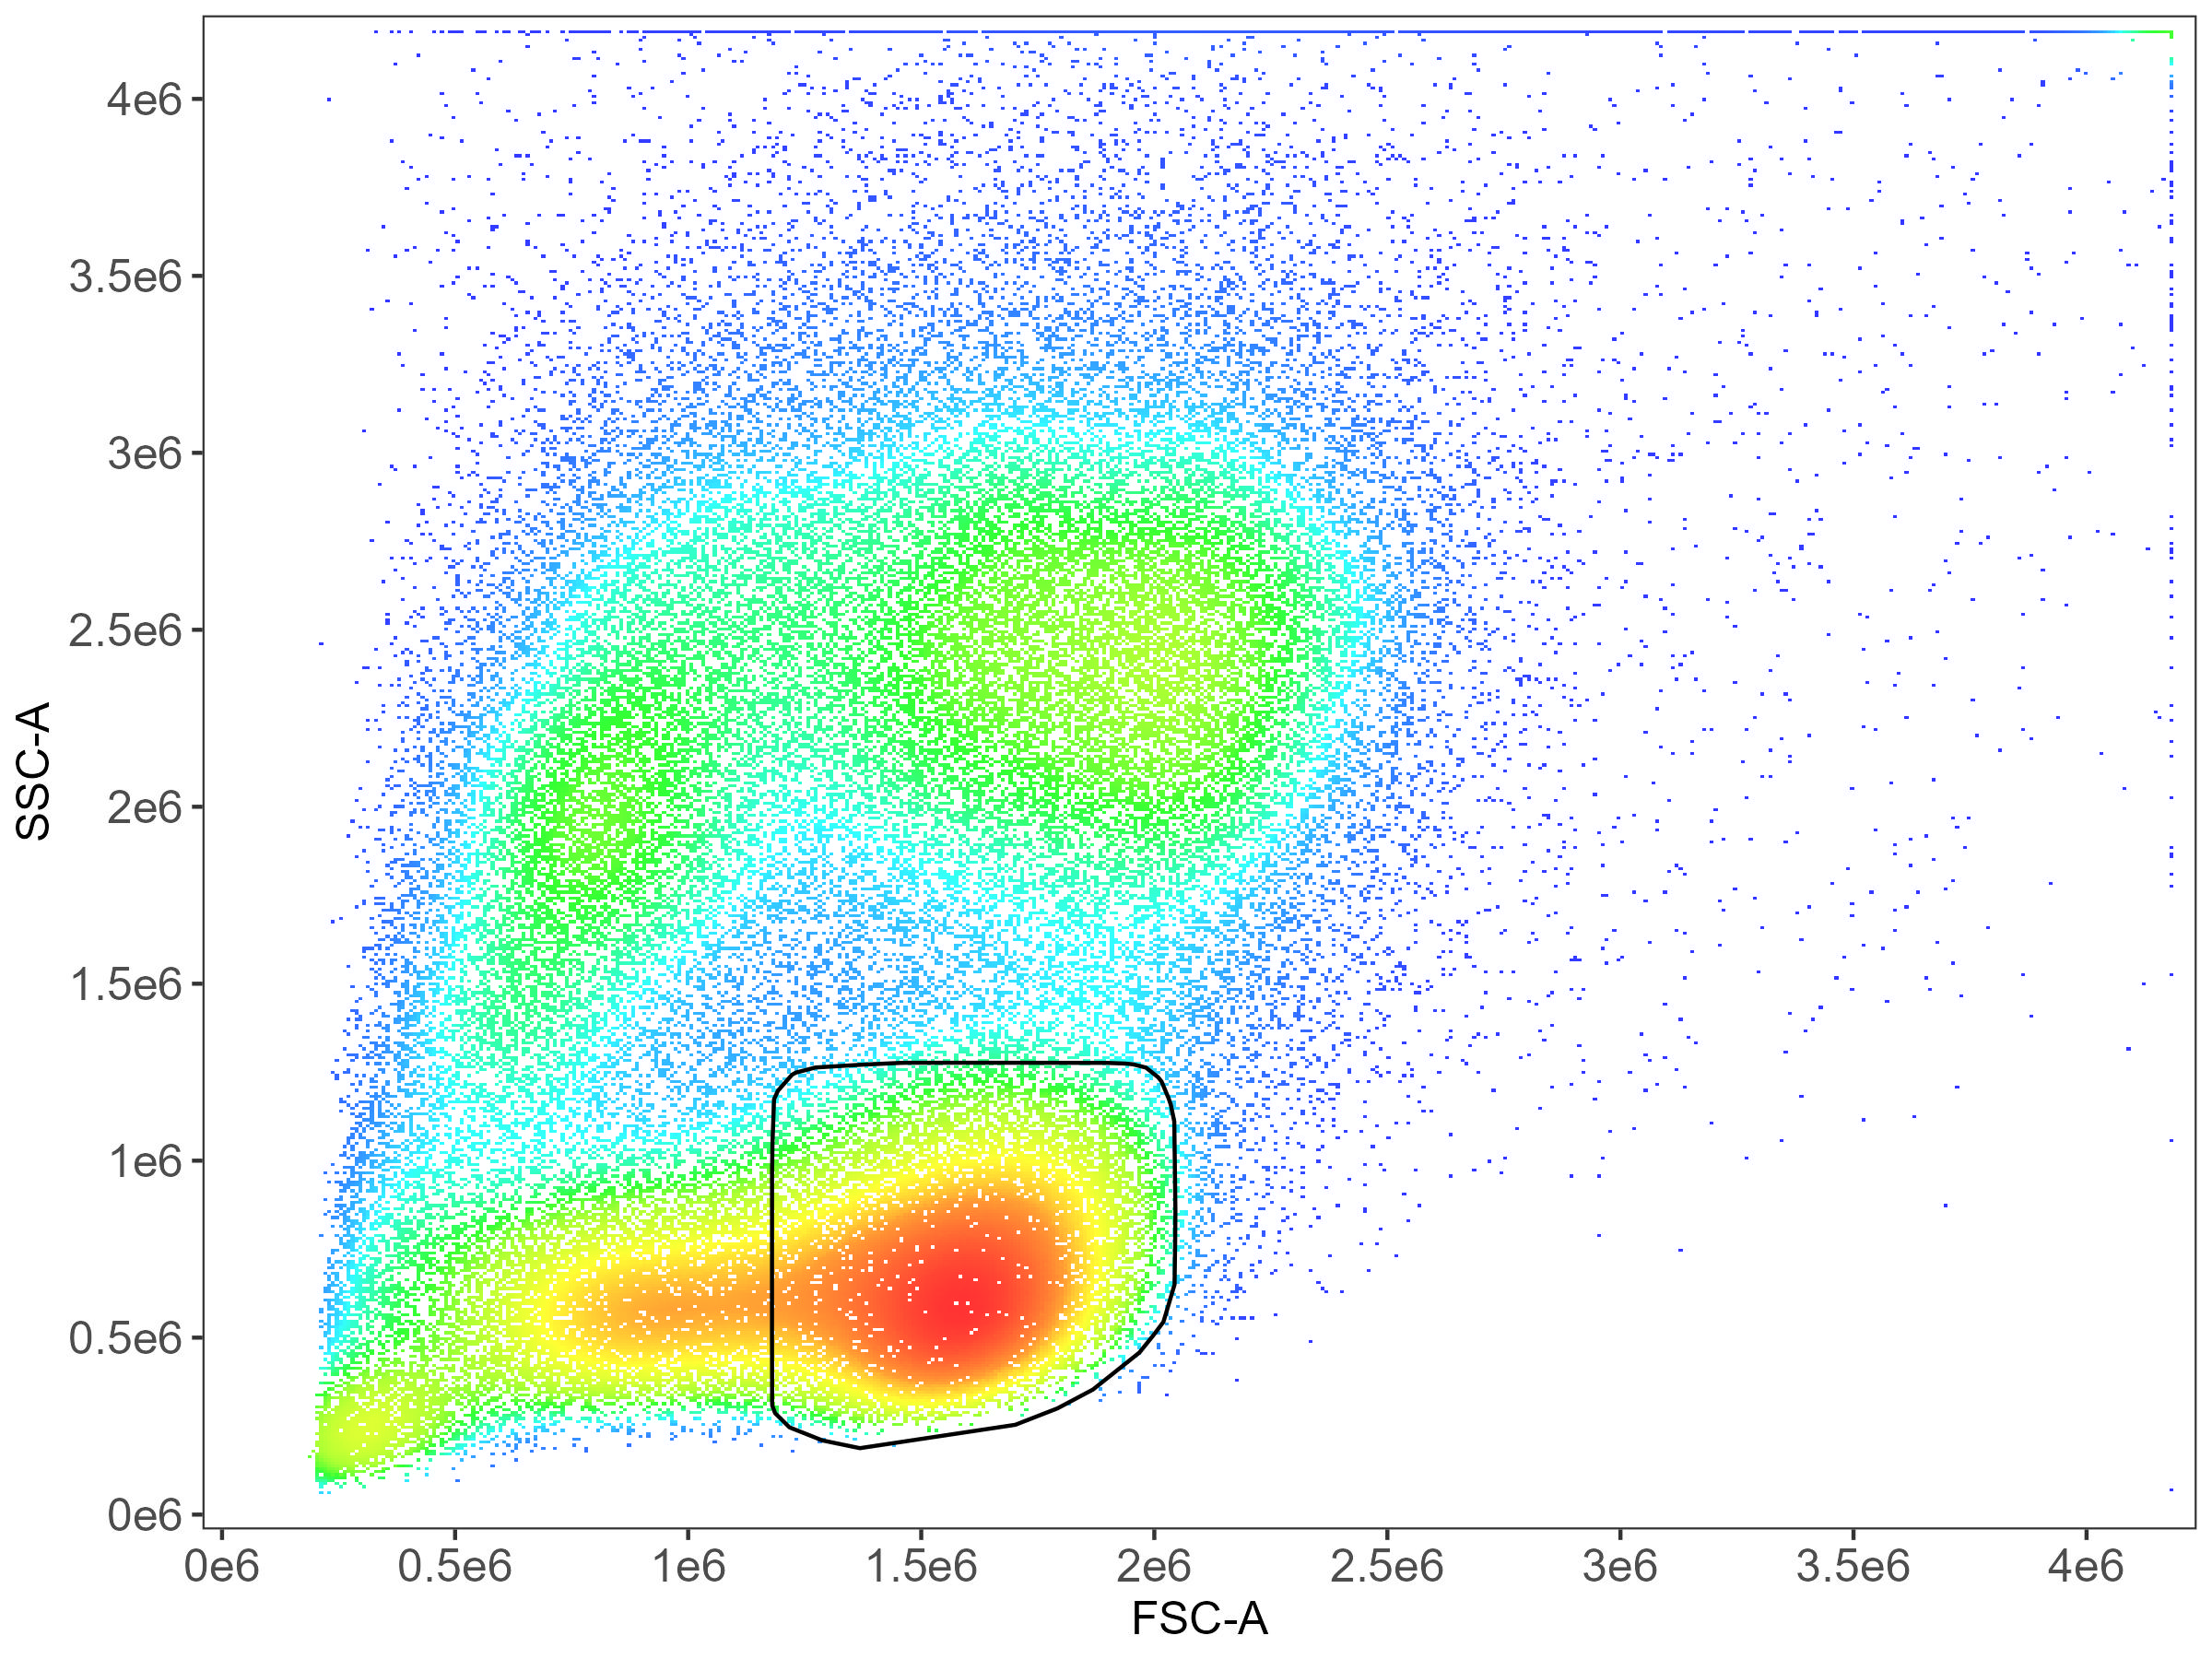
CD14 monocyte gating: 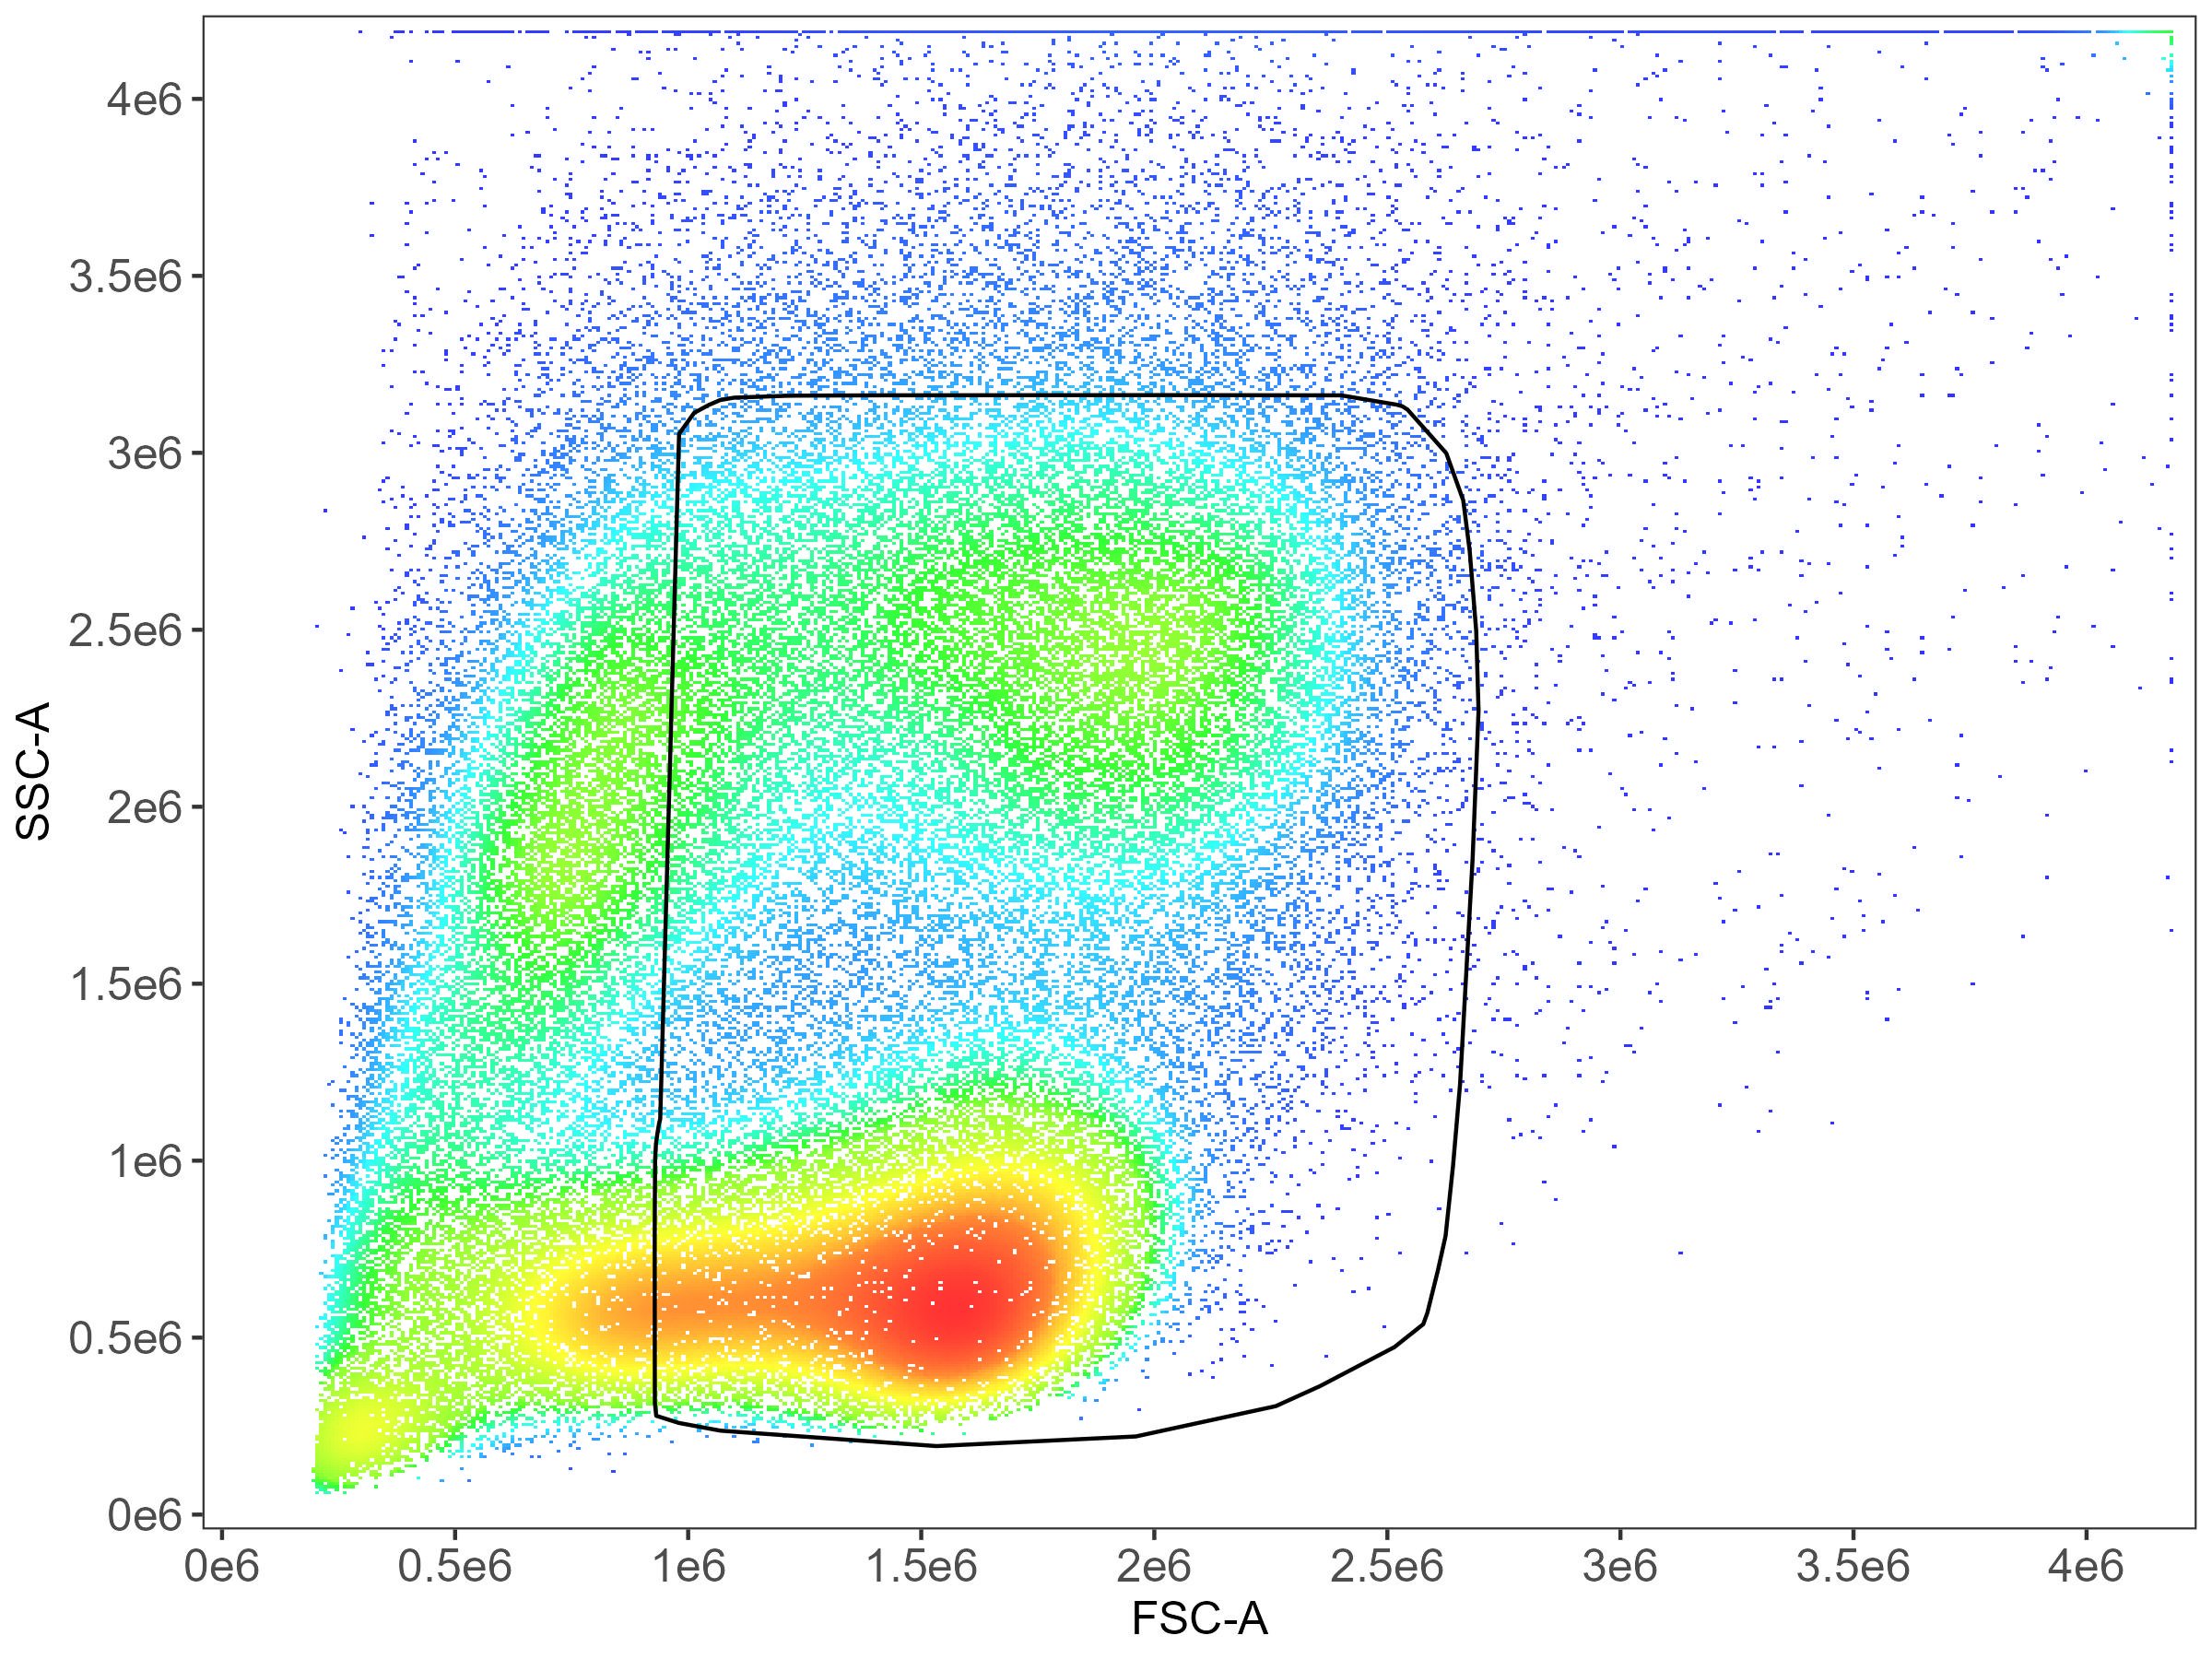
There are several parameters that control the automated gating. This will be covered in a separate article.
Control cleaning is always recommended. The default option downsamples and sets universal negatives, provided these are specified in the control file. More detail on this in the Cleaning article.
flow.control <- clean.controls(flow.control, asp)This generates scatter-matching plots showing the FSC/SSC of the positive events and events from the universal negative in the same region.
CD8 scatter-matching plot: 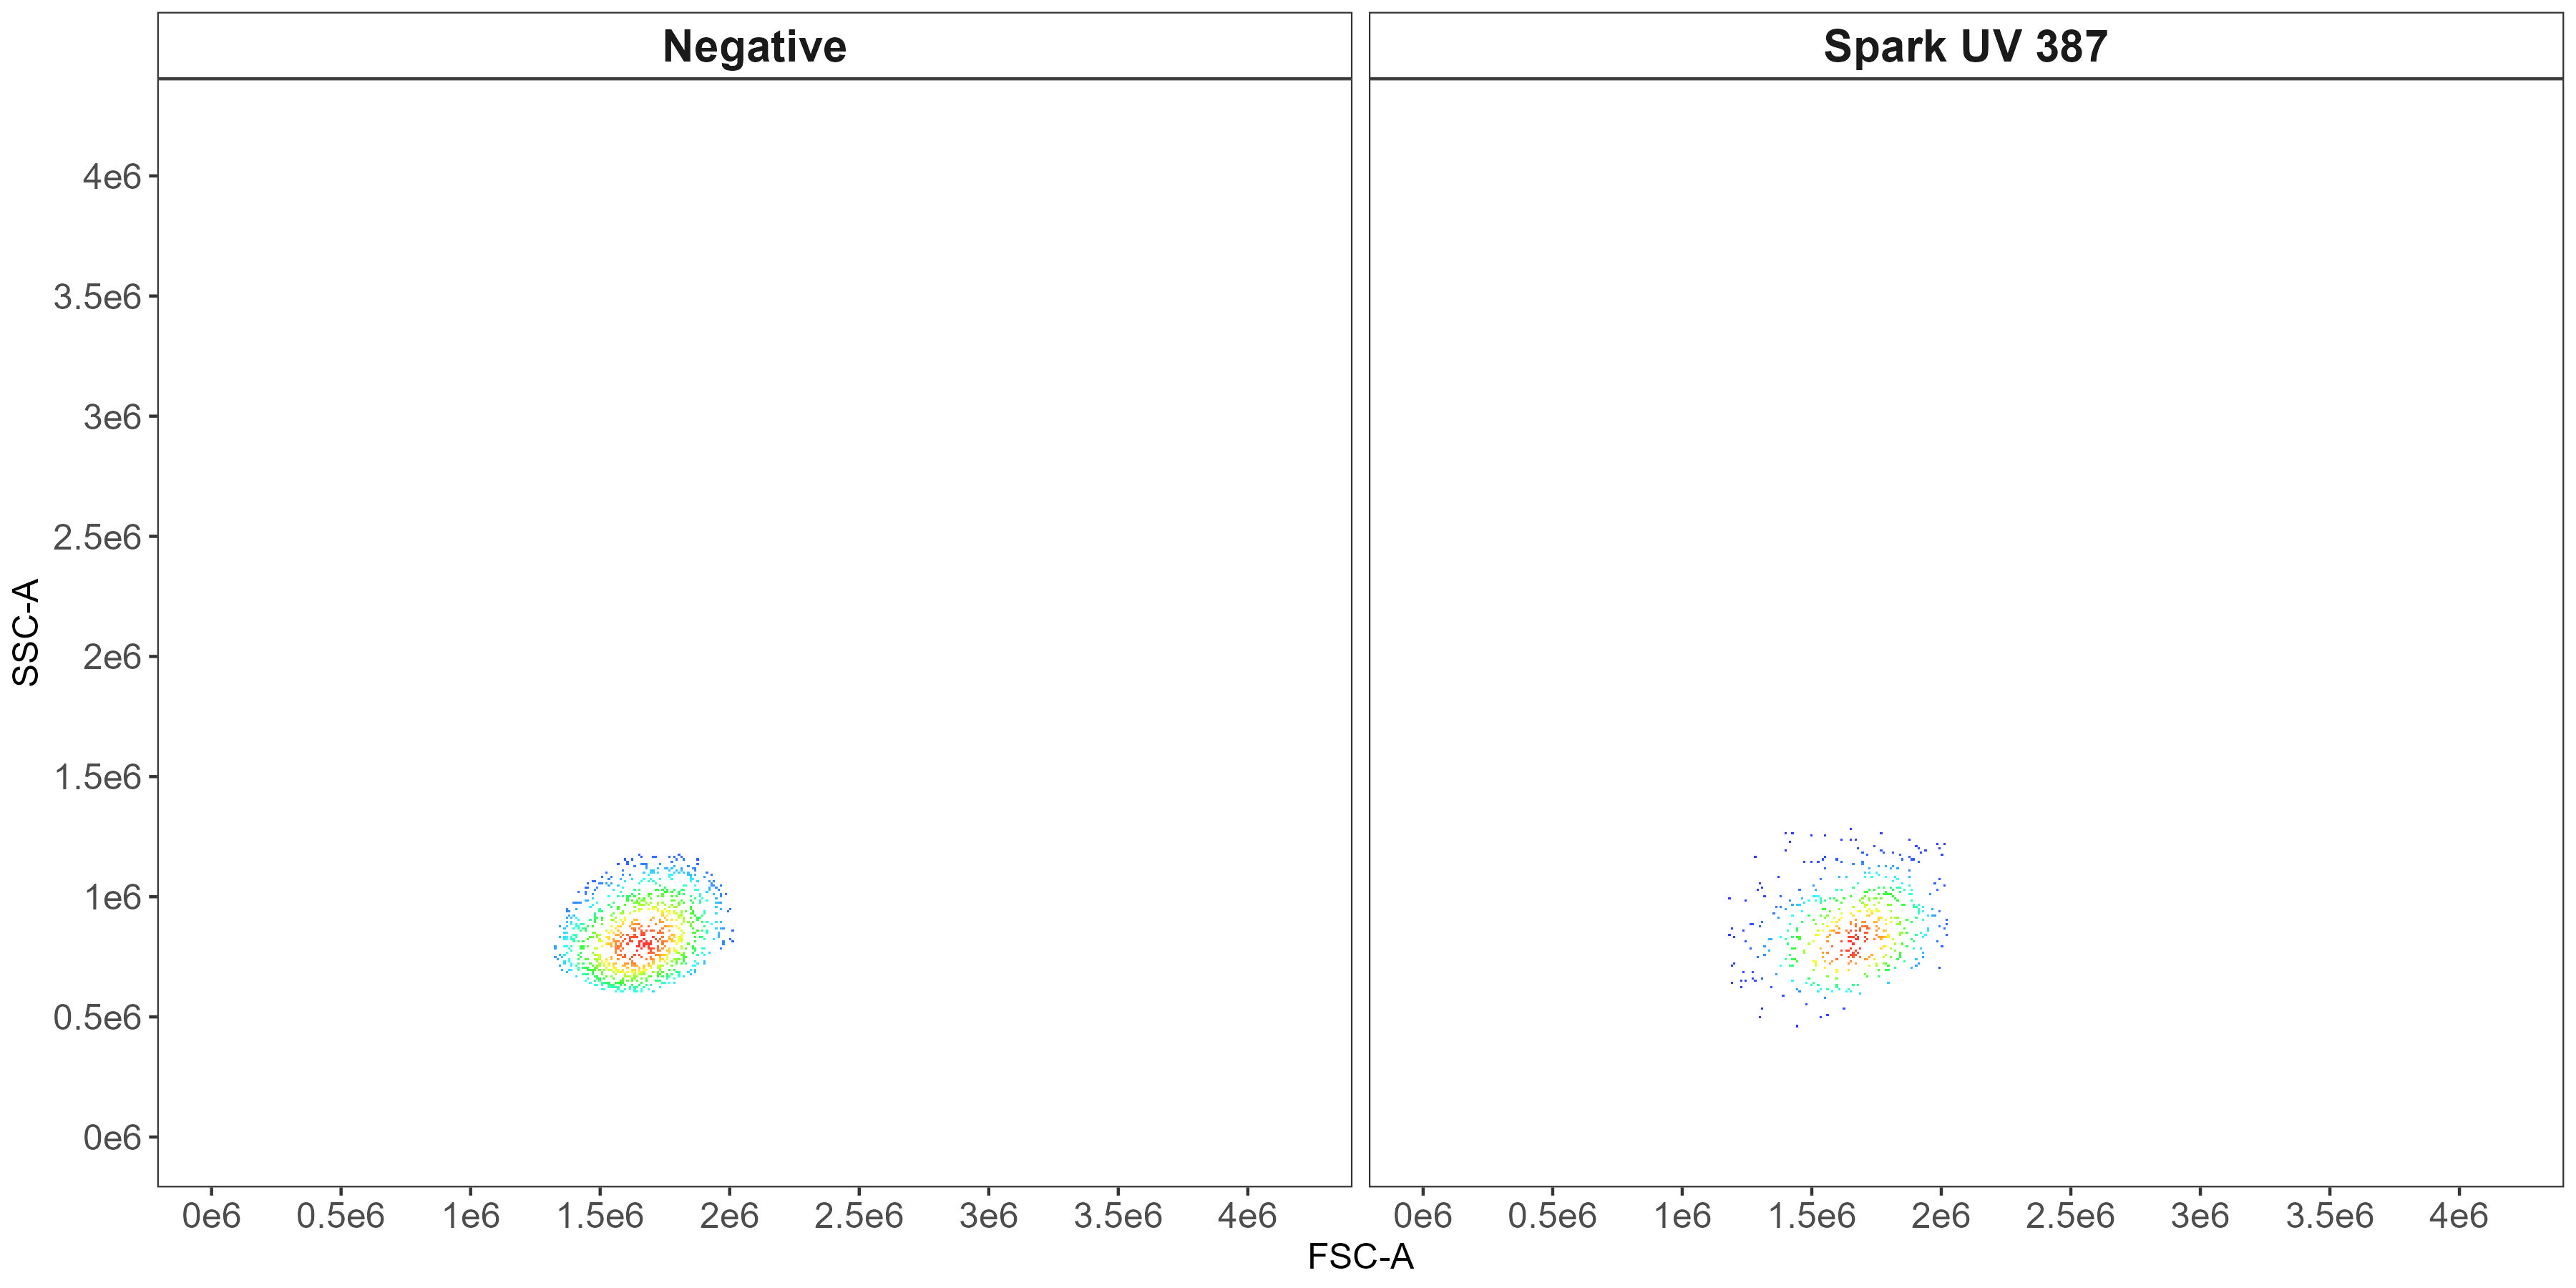
CD14 scatter-matching plot: 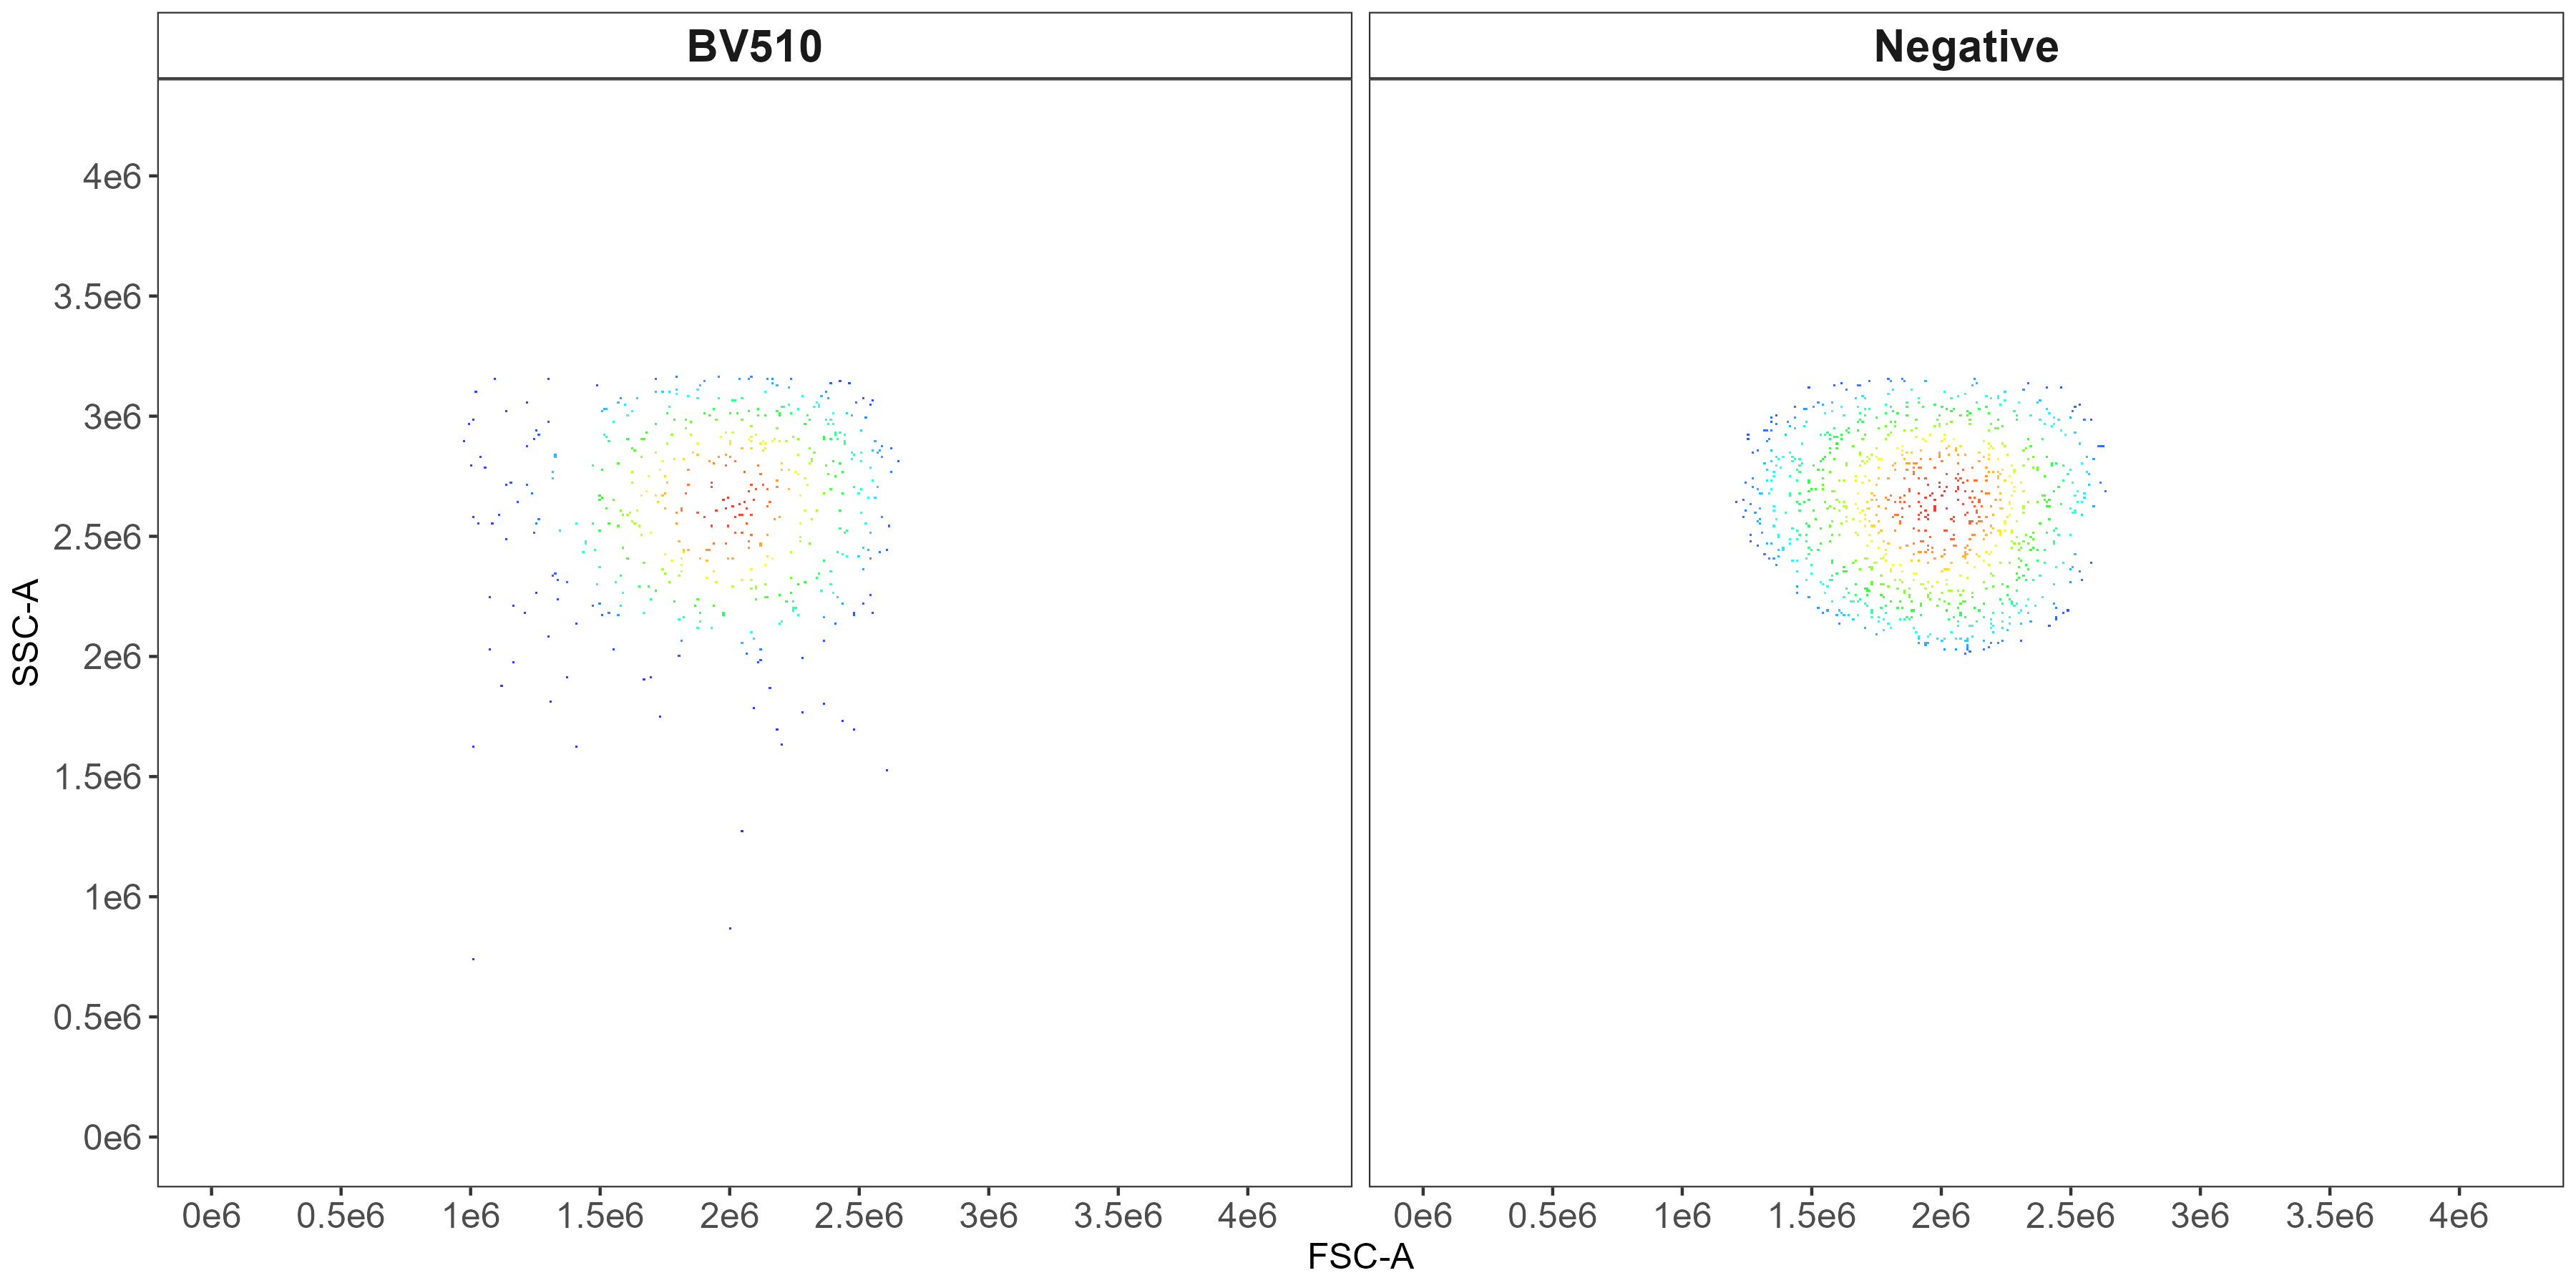
Spectra can now be isolated from the controls. To use the cleaned
data, set use.clean.expr to TRUE.
spectra <- get.fluorophore.spectra(flow.control, asp, use.clean.expr = TRUE)Check the spectral traces and heatmaps–do they look right?
Normalized fluorophore signatures: 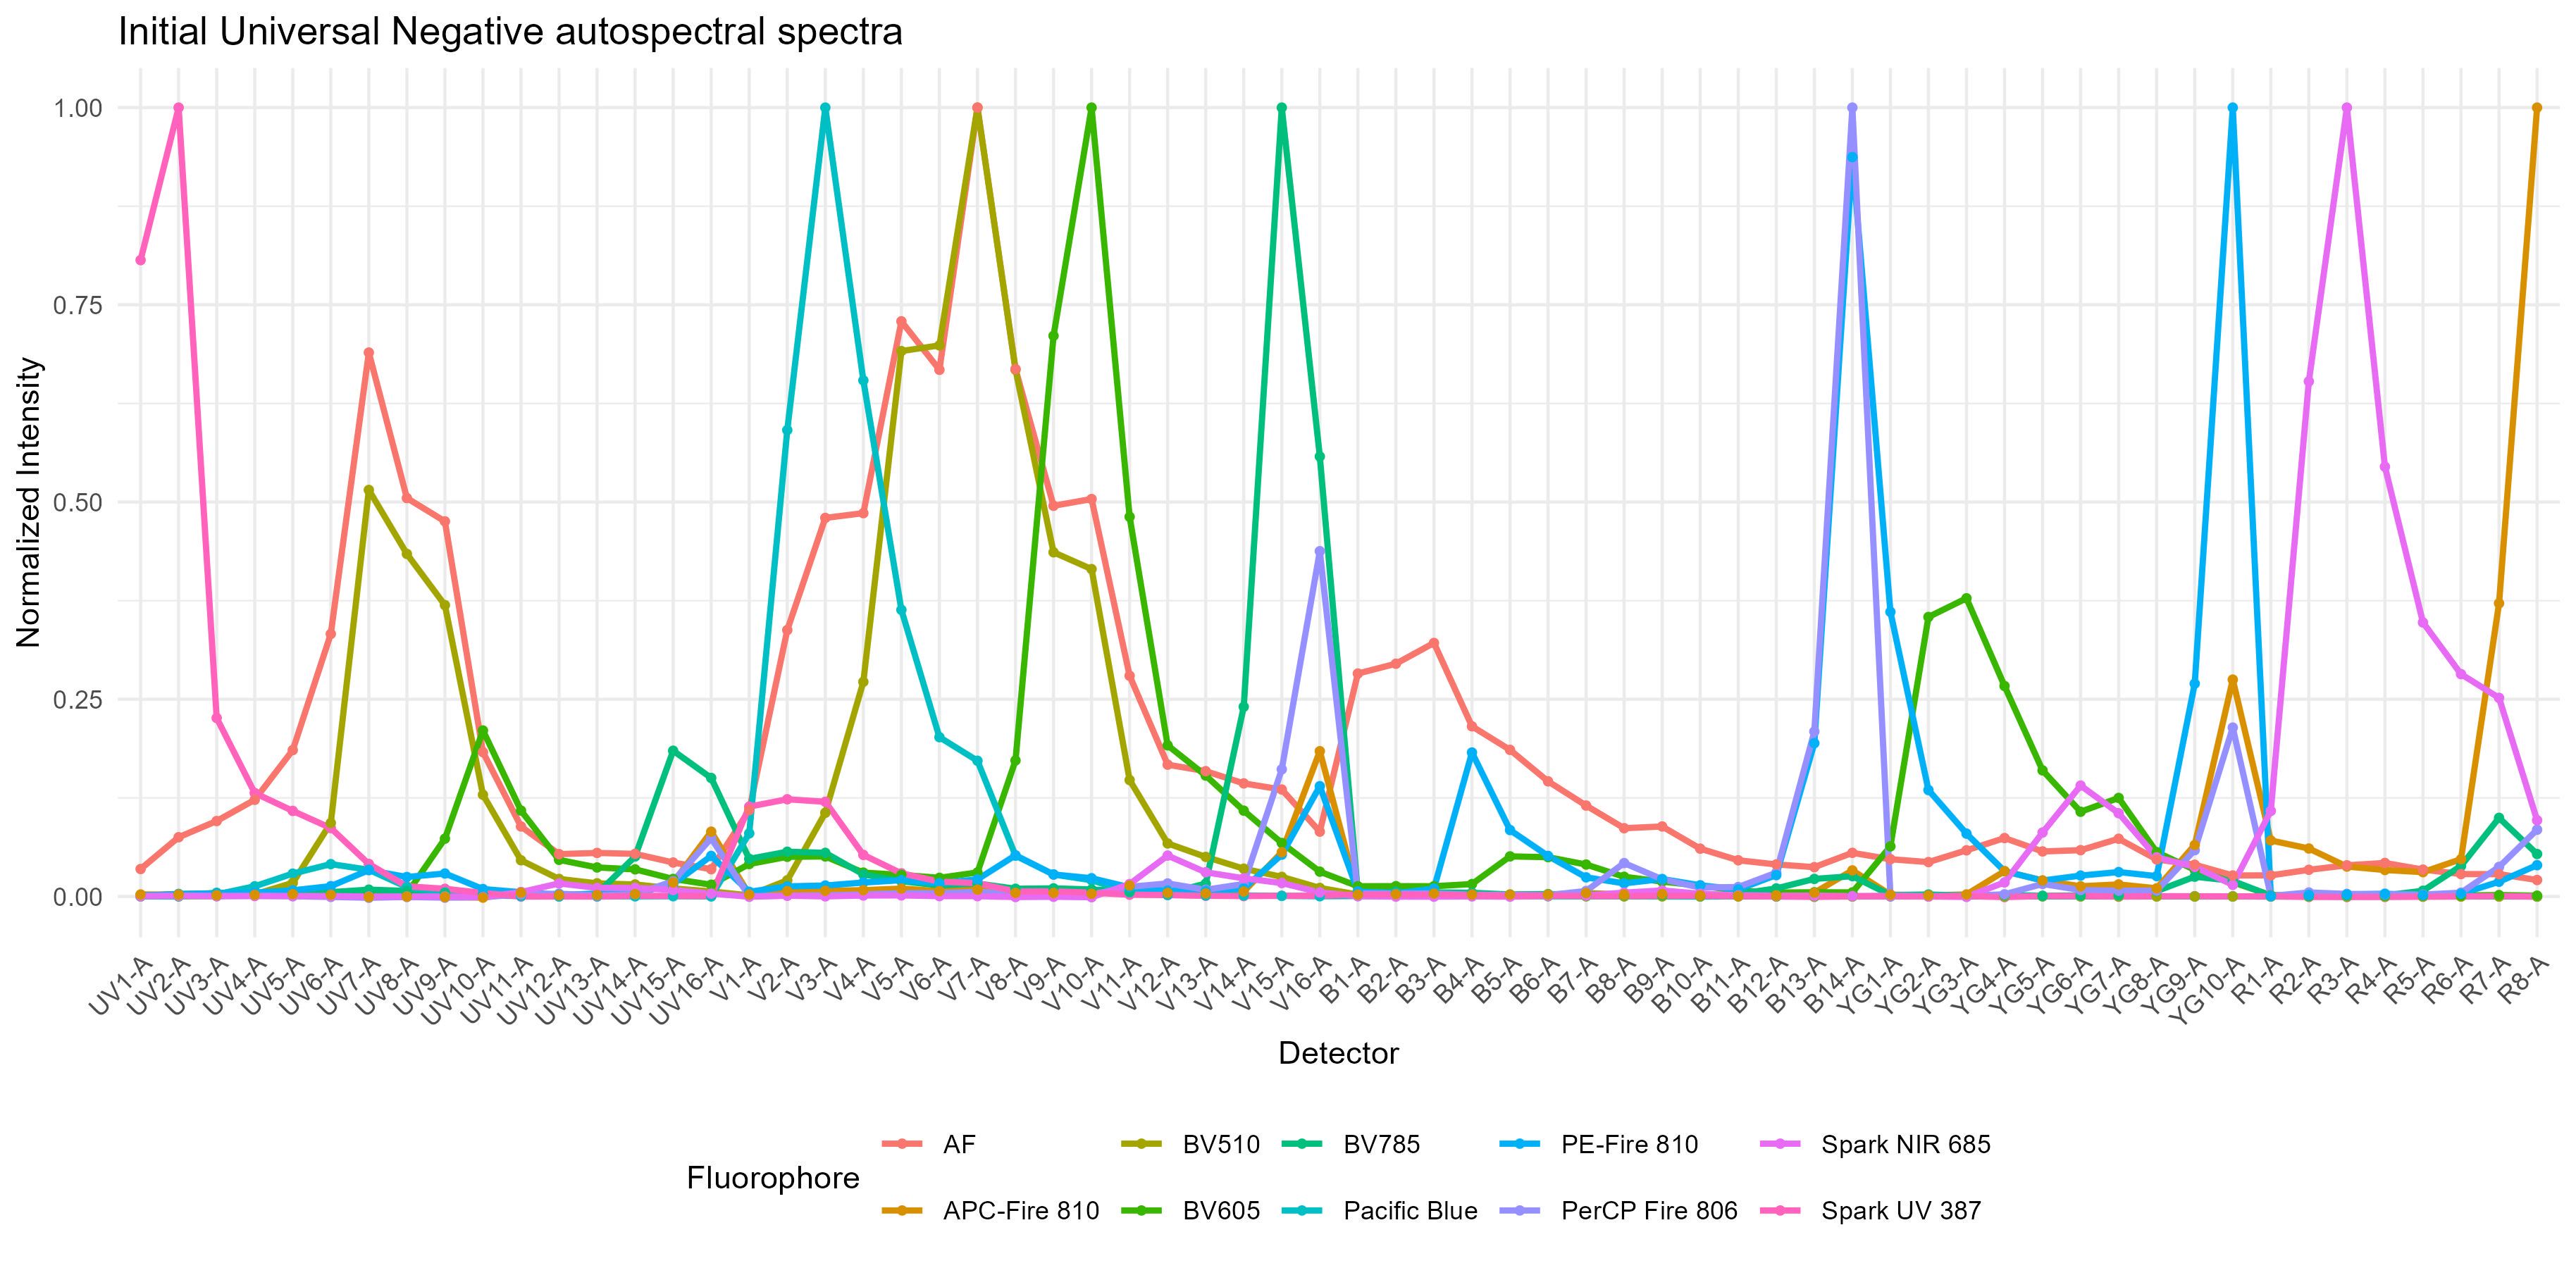 Spectral heatmap:
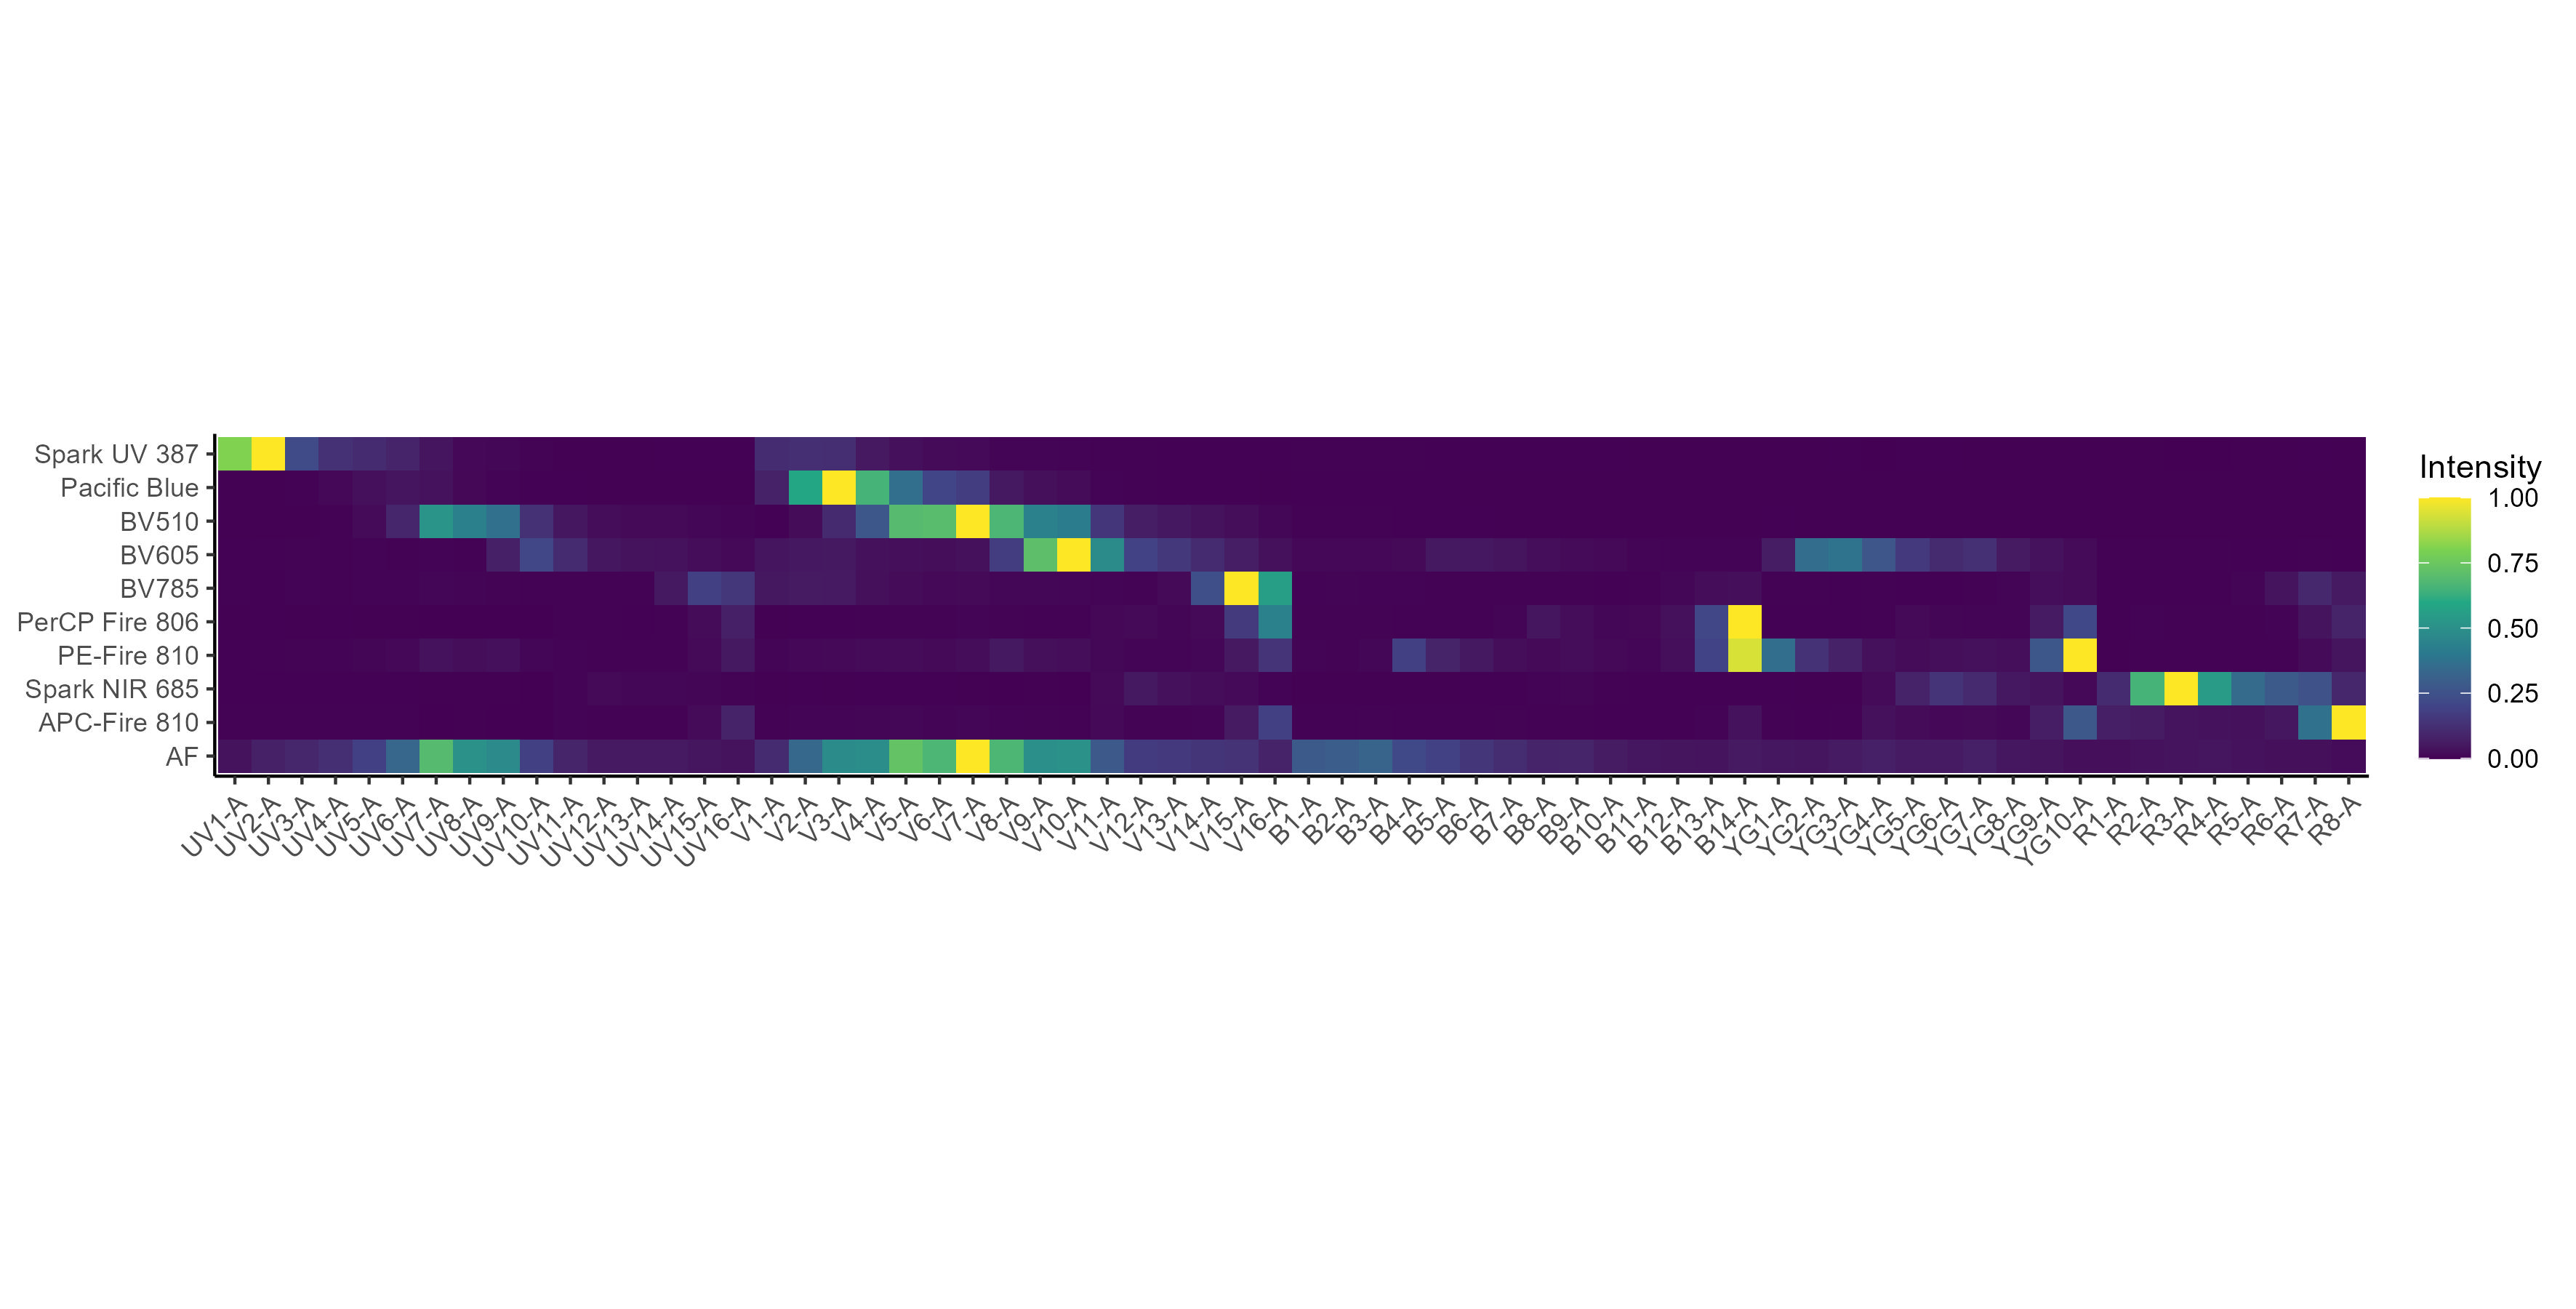
Now we can unmix.
In this example we’re just going to cover basic unmixing using ordinary least squares, which is what you’ll get in SpectroFlo on the Aurora. By default, AutoSpectral extracts a single AF parameter, much like selecting the “spectral unmixing with autofluorescence extraction” option. To unmix without AF extraction, remove this from the spectral matrix:
fluorophore.only.spectra <- spectra[rownames(spectra) != "AF", ]We can unmix a single FCS file:
unmix.fcs("~/AutoSpectral_data/Aurora_example/Aurora_fully_stained/E1 Fresh_100ul_TS_BS_005.fcs",
          spectra, asp, flow.control, method = "OLS")
Or, if we have a bunch of files in the folder, we can unmix them all:
unmix.folder("~/AutoSpectral_data/Aurora_example/AutoSpectral/Aurora_fully_stained/",
             spectra, asp, flow.control, method = "OLS")
By default, parallel processing is off. To activate it for faster unmixing, set:
asp$parallel <- TRUEDo this before calling the function, e.g.,
define.flow.control or clean.controls. Turn it
off again at any point:
asp$parallel <- FALSE