Single Cell Autofluorescence
Source:vignettes/articles/Single_Cell_AutoFluorescence.Rmd
Single_Cell_AutoFluorescence.RmdThe aim of this article is to show you how to use AutoSpectral’s per-cell autofluorescence (AF) extraction. This method selects the best AF signature to use for each cell (or point of debris, noise, whatever) in the data.
The first thing we need to do is discover all of the AF signatures present in the data. For this, the unstained control is critical. For good results, you need to do the following in your wet lab work: * 1) Prepare a truly unstained sample. This means no added fluorophores, so no conjugated antibodies or live/dead stains and no fluorescent buffers such as the Brilliant Stain buffer. This also means no fluorescent reporters. If you run GFP expressing cells as your unstained, the GFP signal in those will be considered an AF signature, and it will be unmixed as autofluorescence rather than GFP. If you contaminate your unstained with small amounts of stained cells, single-stained controls or fluorescent beads, those signatures may also be considered to be AF. * 2) Treat your unstained sample like your fully stained sample. Run it through the same protocol. If you’re fixing and permeabilizing, do that to the unstained, too. * 3) Acquire lots of cells. If you only acquire 10 thousand events, you will have very little data to work with, and rare populations, which are probably the problematic ones, will not show up well. Ideally, run as many cells as in your fully stained samples. * 4) Run unstained samples for each sample type in your data if you expect a difference in AF For example, with tissue samples, run a sample from spleen, lymph nodes and lung, not just spleen or lung. If you’re running samples from drastically different conditions (e.g., infected vs. healthy or infant vs. adult), I suggest running an unstained for each. * 5) For smaller differences in conditions, you will probably get good results by creating a pooled unstained sample. For instance, when running PBMC from multiple donors, you could take a few cells from each for the unstained sample for AF.
You’re welcome to play around with breaking these rules to see what happens.
A note about pooling: This can be done in the wet lab by mixing the
cells into a single tube. A safer, and likely more representative option
is to mix in silico after acquisition. This can be done by concatenating
the FCS files or by using a function such as
AggregateFlowFrame() from FlowSOM. I really,
really do not recommend concatenating with FlowJo v10 (and have not
tested v11). Also, premessa also does not produce FCS files
with all the information intact, so avoid that.
Before doing the single-cell AF extraction, you’ll need to either run the AutoSpectral workflow to extract your fluorescence spectra or extract the spectra using another method (e.g., FlowJo or from the Cytek .Expt file). This is because we will use these spectra in the determination of the AF spectra. We’re going to be looking at both the raw and unmixed versions of the unstained sample in order to determine how the AF signatures present are likely to interfere with the unmixing.
asp <- get.autospectral.param( cytometer = "aurora", figures = TRUE )
control.dir <- "./SSC"
control.file <- "fcs_control_file.csv"
flow.control <- define.flow.control( control.dir, control.file, asp )
flow.control <- clean.controls( flow.control, asp )
spectra <- get.fluorophore.spectra( flow.control, asp, use.clean.expr = TRUE,
                                    title = "Clean Spectra" )
Now we are ready to get the AF spectra. For this data set, we have
spleen, lung and brain samples from mouse. We can do all three. I’ve got
the files in the ./SSC folder, but be sure to pass the file
path as well as the file name to the first argument of
get.af.spectra.
unstained.lung <- "G2 WT Lung_Samples.fcs"
unstained.brain <- "G3 WT Brain_Samples.fcs"
unstained.spleen <- "G1 WT Spleen_Samples.fcs"

lung.af <- get.af.spectra( file.path( control.dir, unstained.lung ),
                           asp, spectra, title = "Lung AF" )
brain.af <- get.af.spectra( file.path( control.dir, unstained.brain ),
                            asp, spectra, title = "Brain AF" )
spleen.af <- get.af.spectra( file.path( control.dir, unstained.spleen ),
                             asp, spectra, title = "Spleen AF" )
This call reads the FCS file, unmixes it, and creates a
self-organizing map (SOM) of the combined raw and unmixed data. Each SOM
node (map$code) is considered an AF signature. Note that
you can increase or decrease the number of spectra generated by changing
the SOM dimensions with argument som.dim. The default
10 generates 100 spectra (10 x 10), which works quite well.
It’s likely overkill for simple AF mixtures like PBMCs, but it does not
hurt except for taking longer during the unmixing. If you have really
messy samples, you could play around with larger SOMs, but the default
settings work well for mouse lung, which is pretty terrible for AF.
We get output plots of the AF signatures in the
figure_autofluorescence folder.
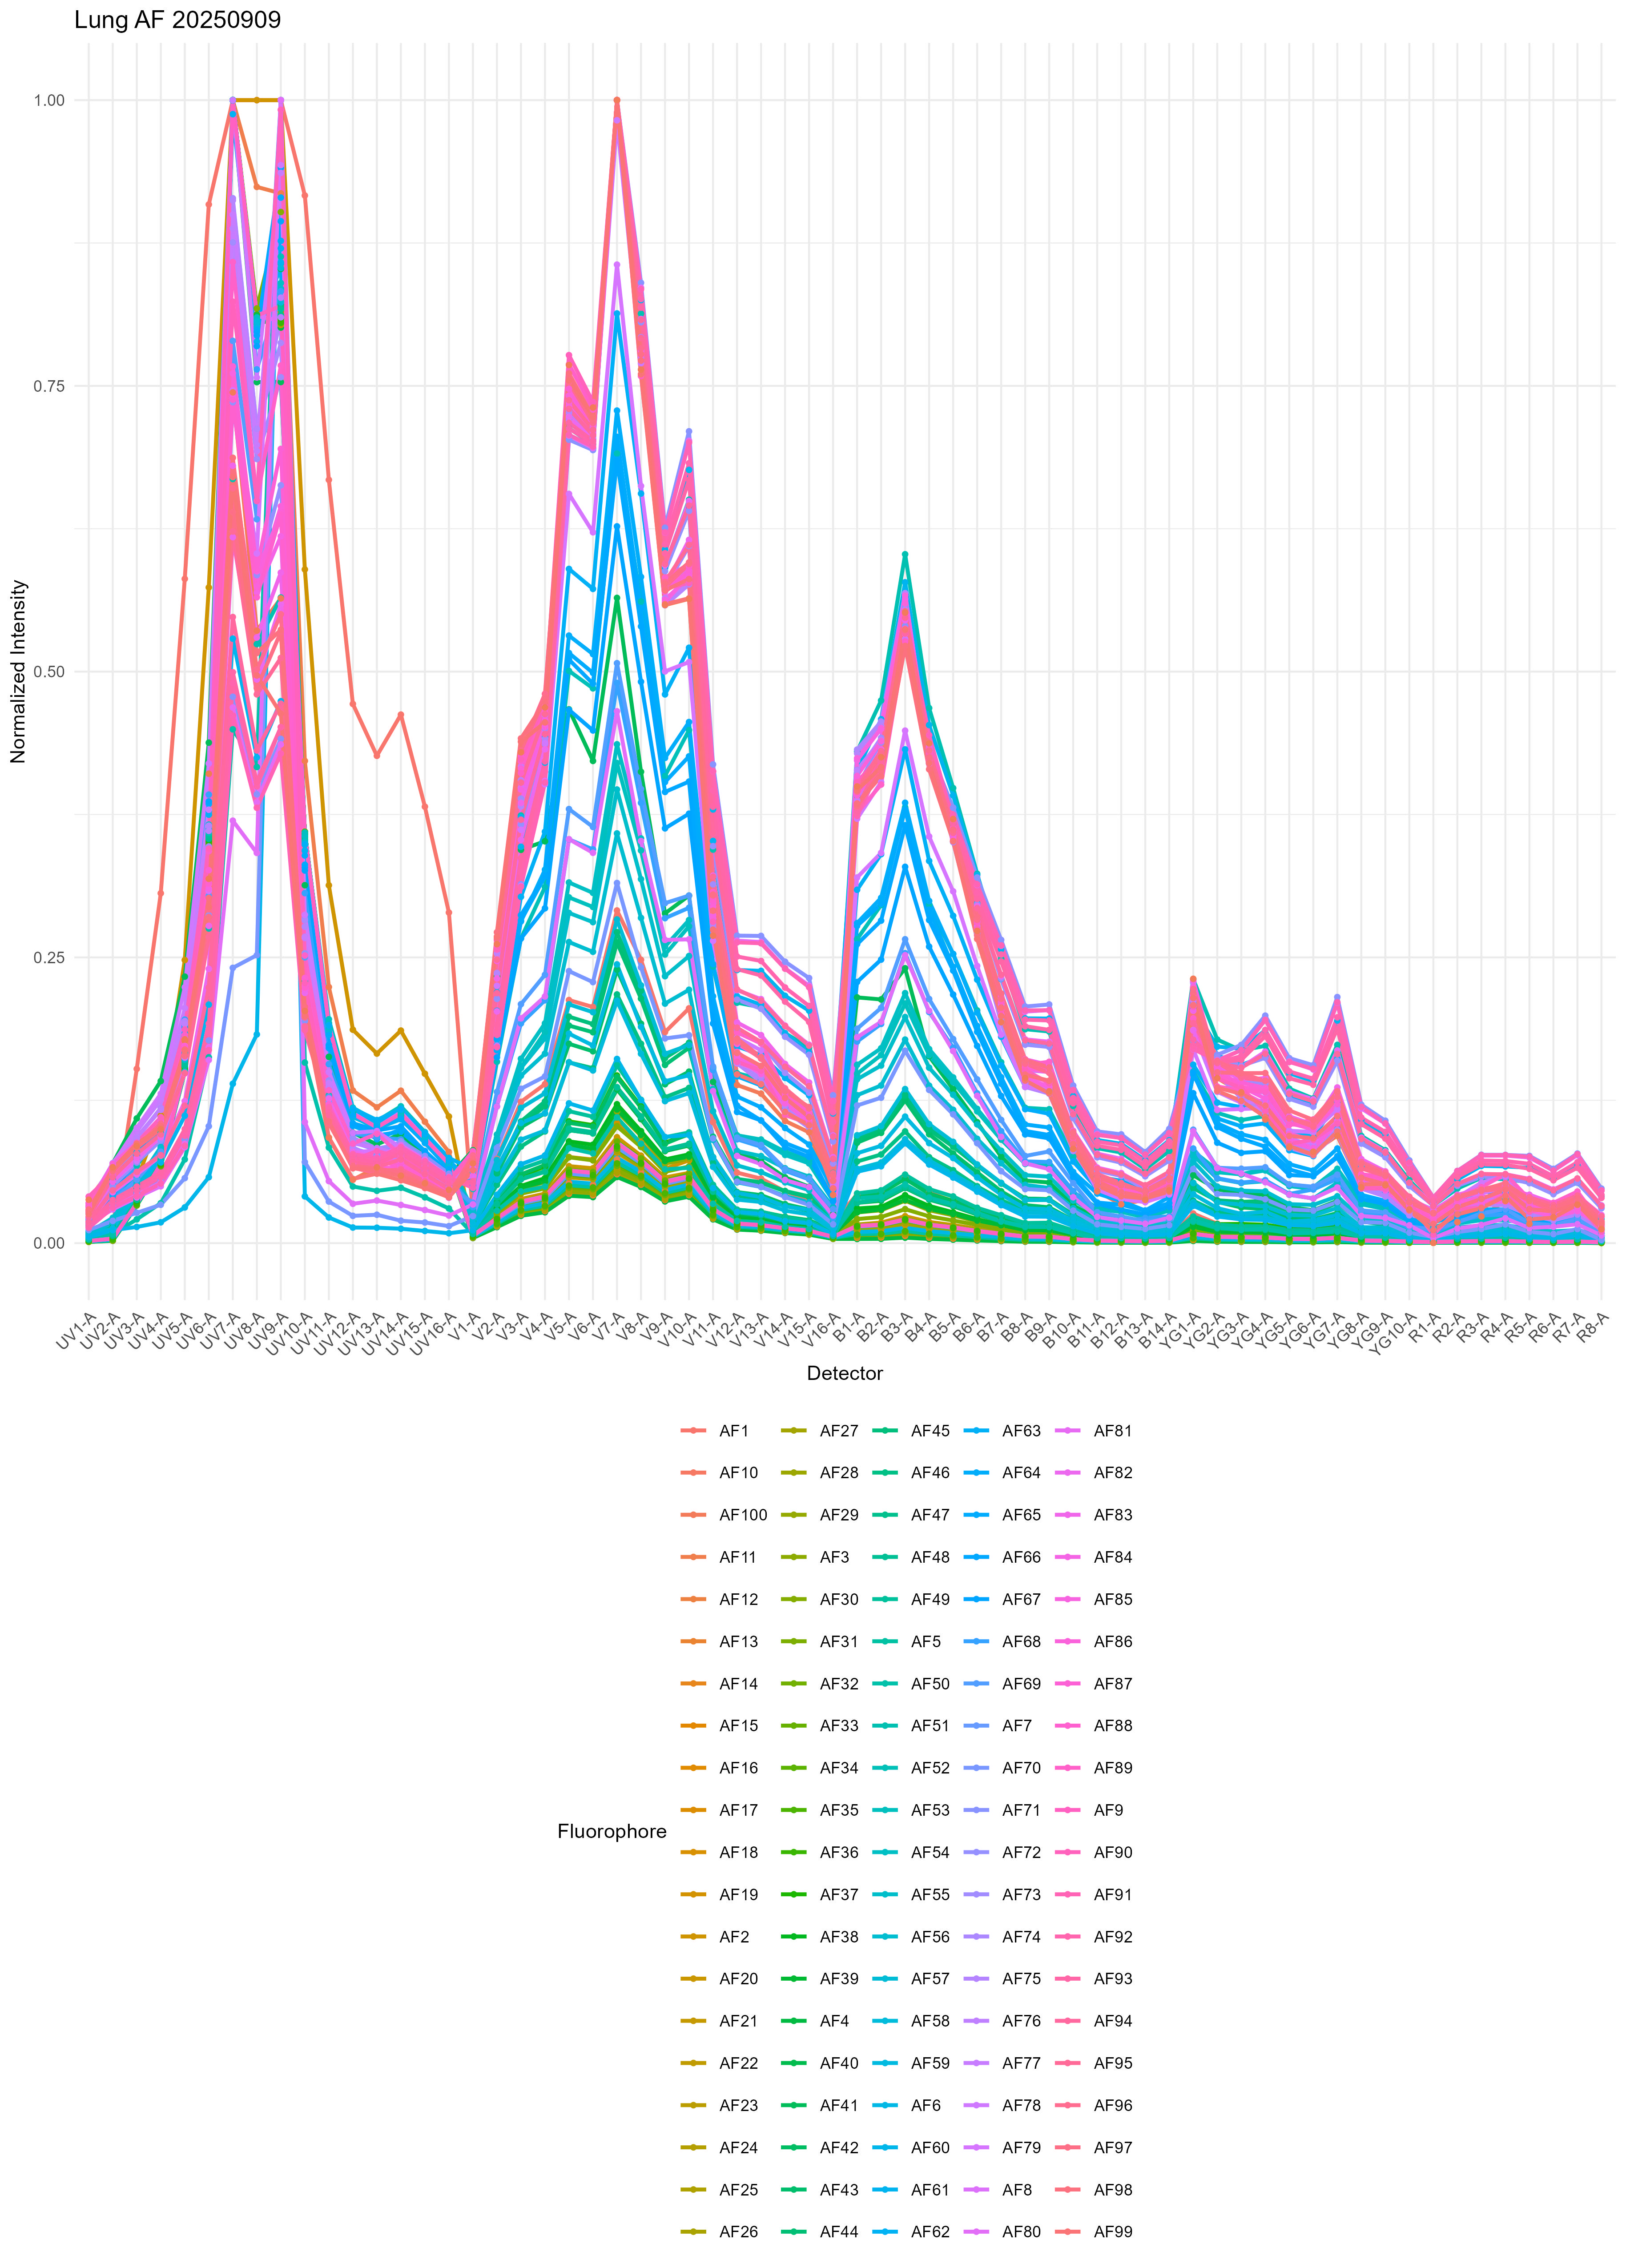
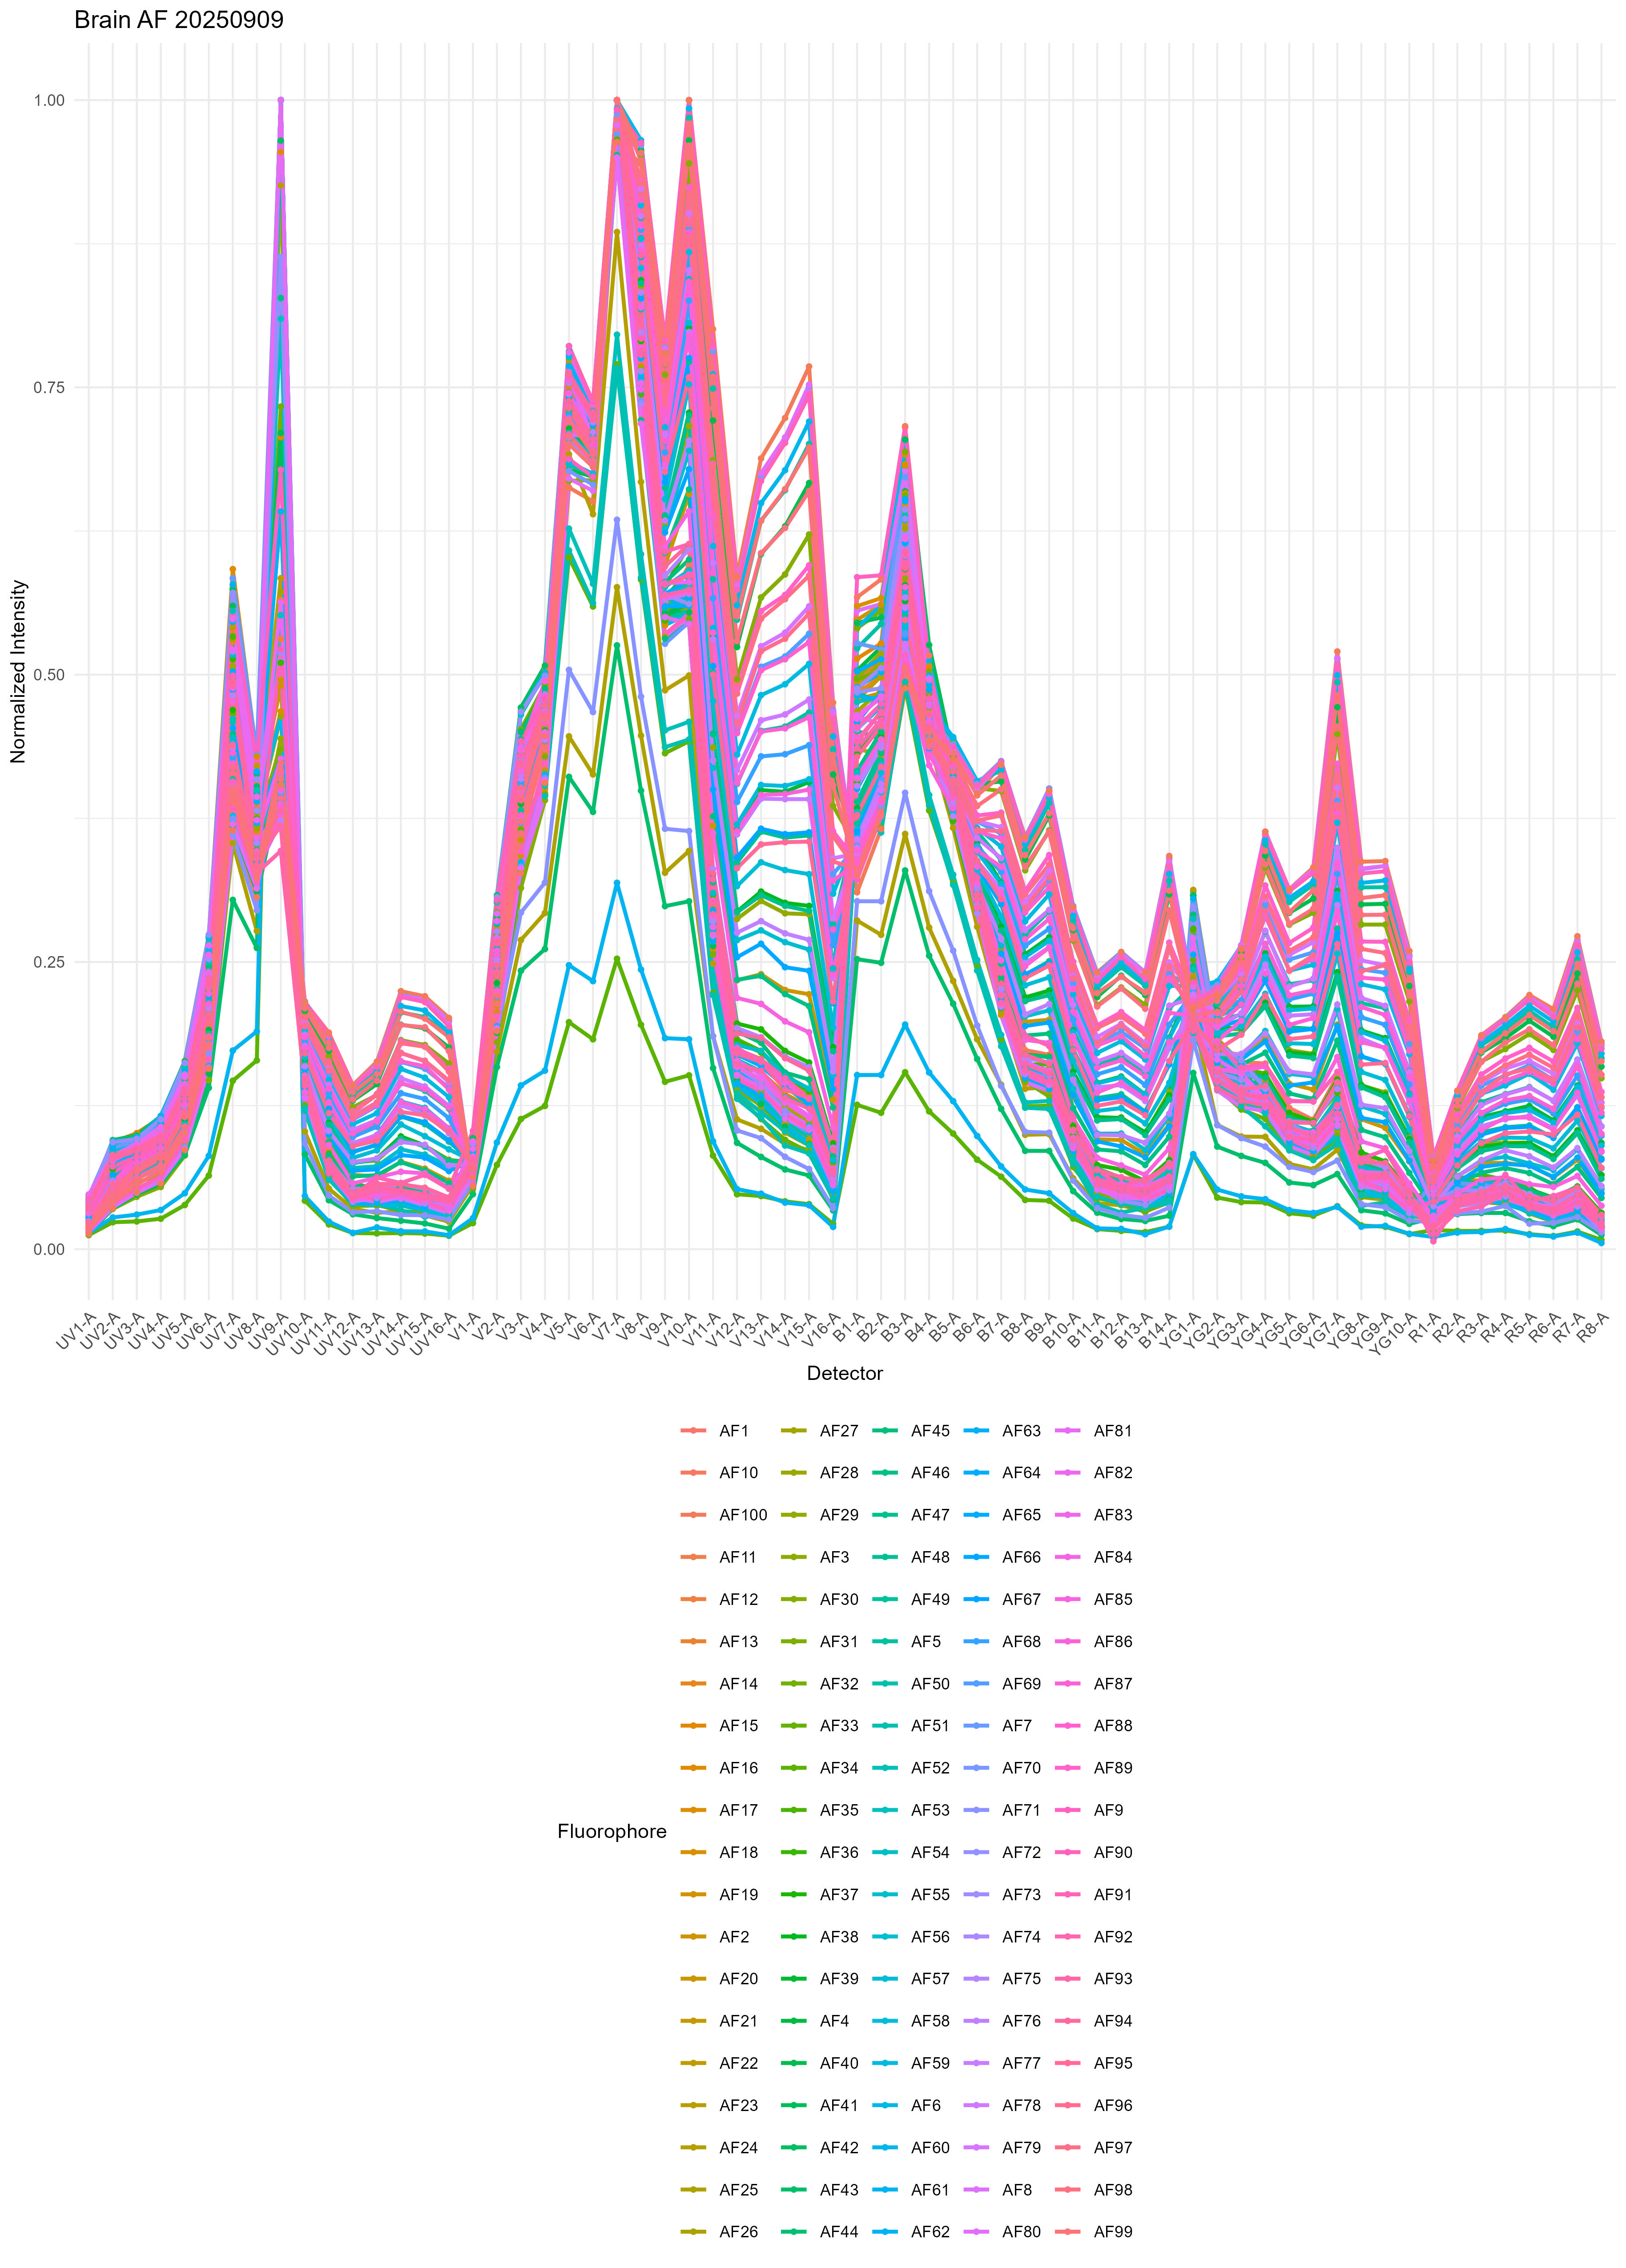
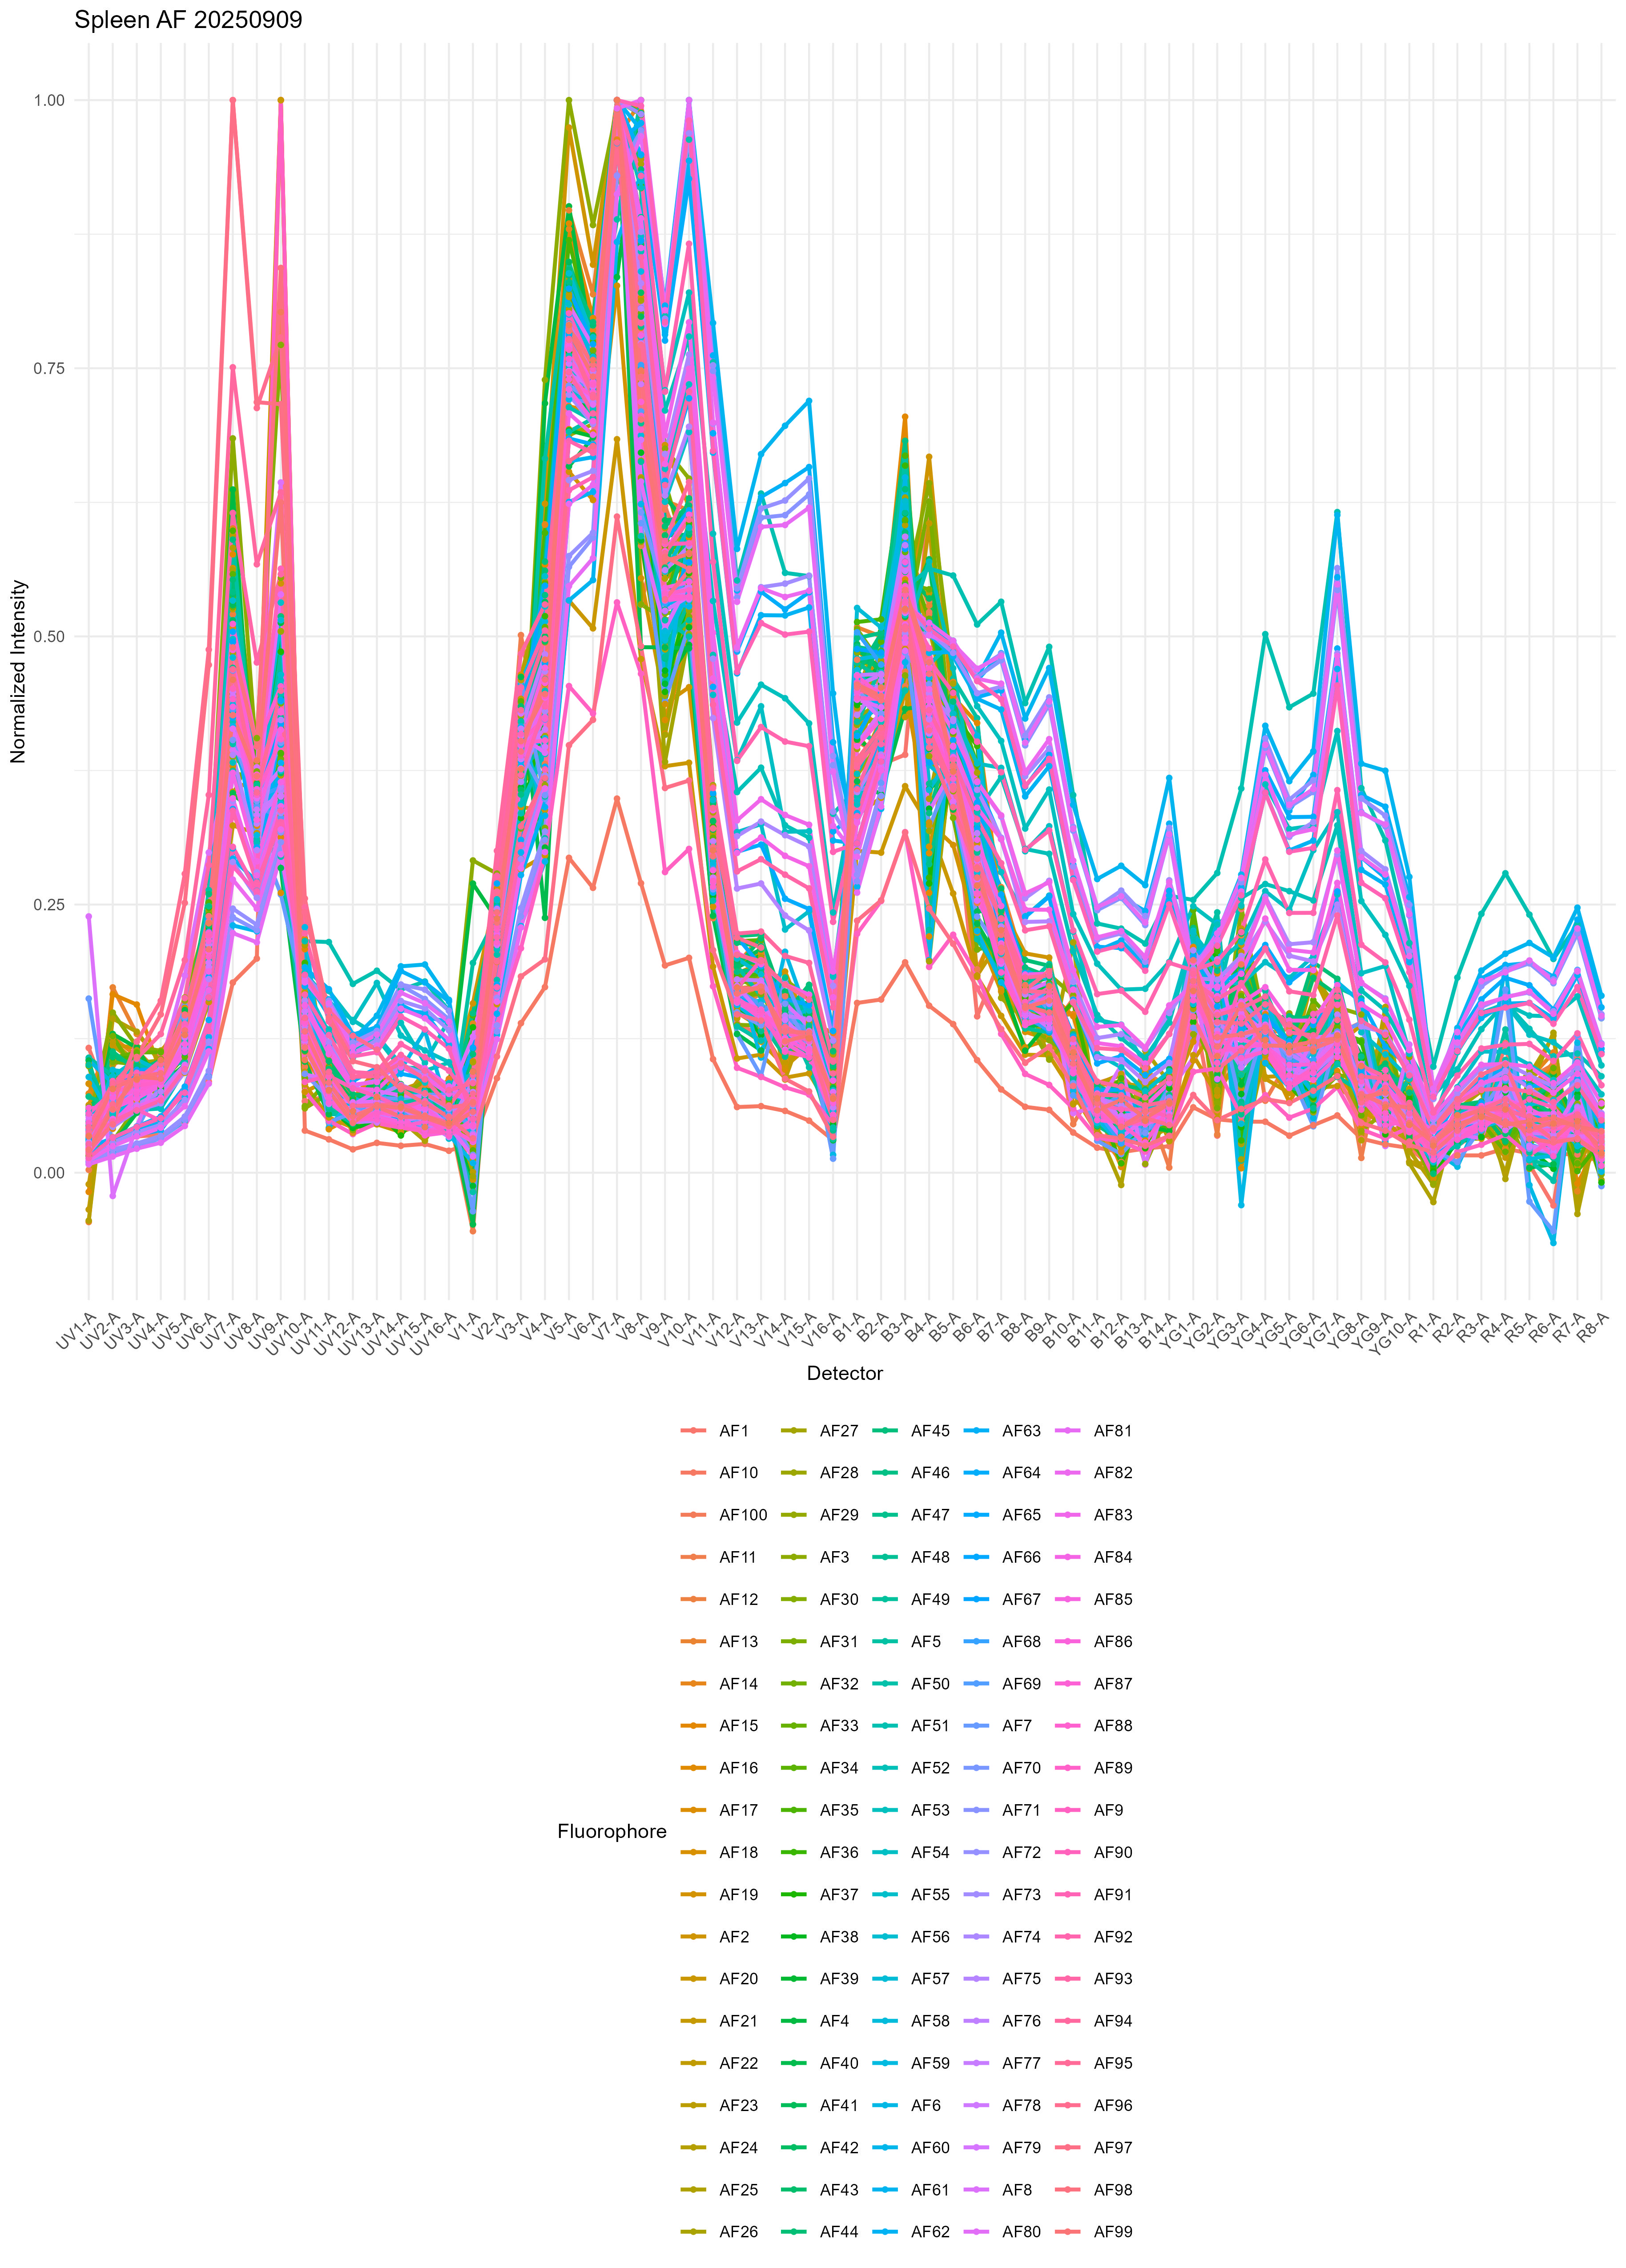
From the variability, I think you can start to understand why it’s really hard to get good results with single or multiple AF extraction using the standard method.
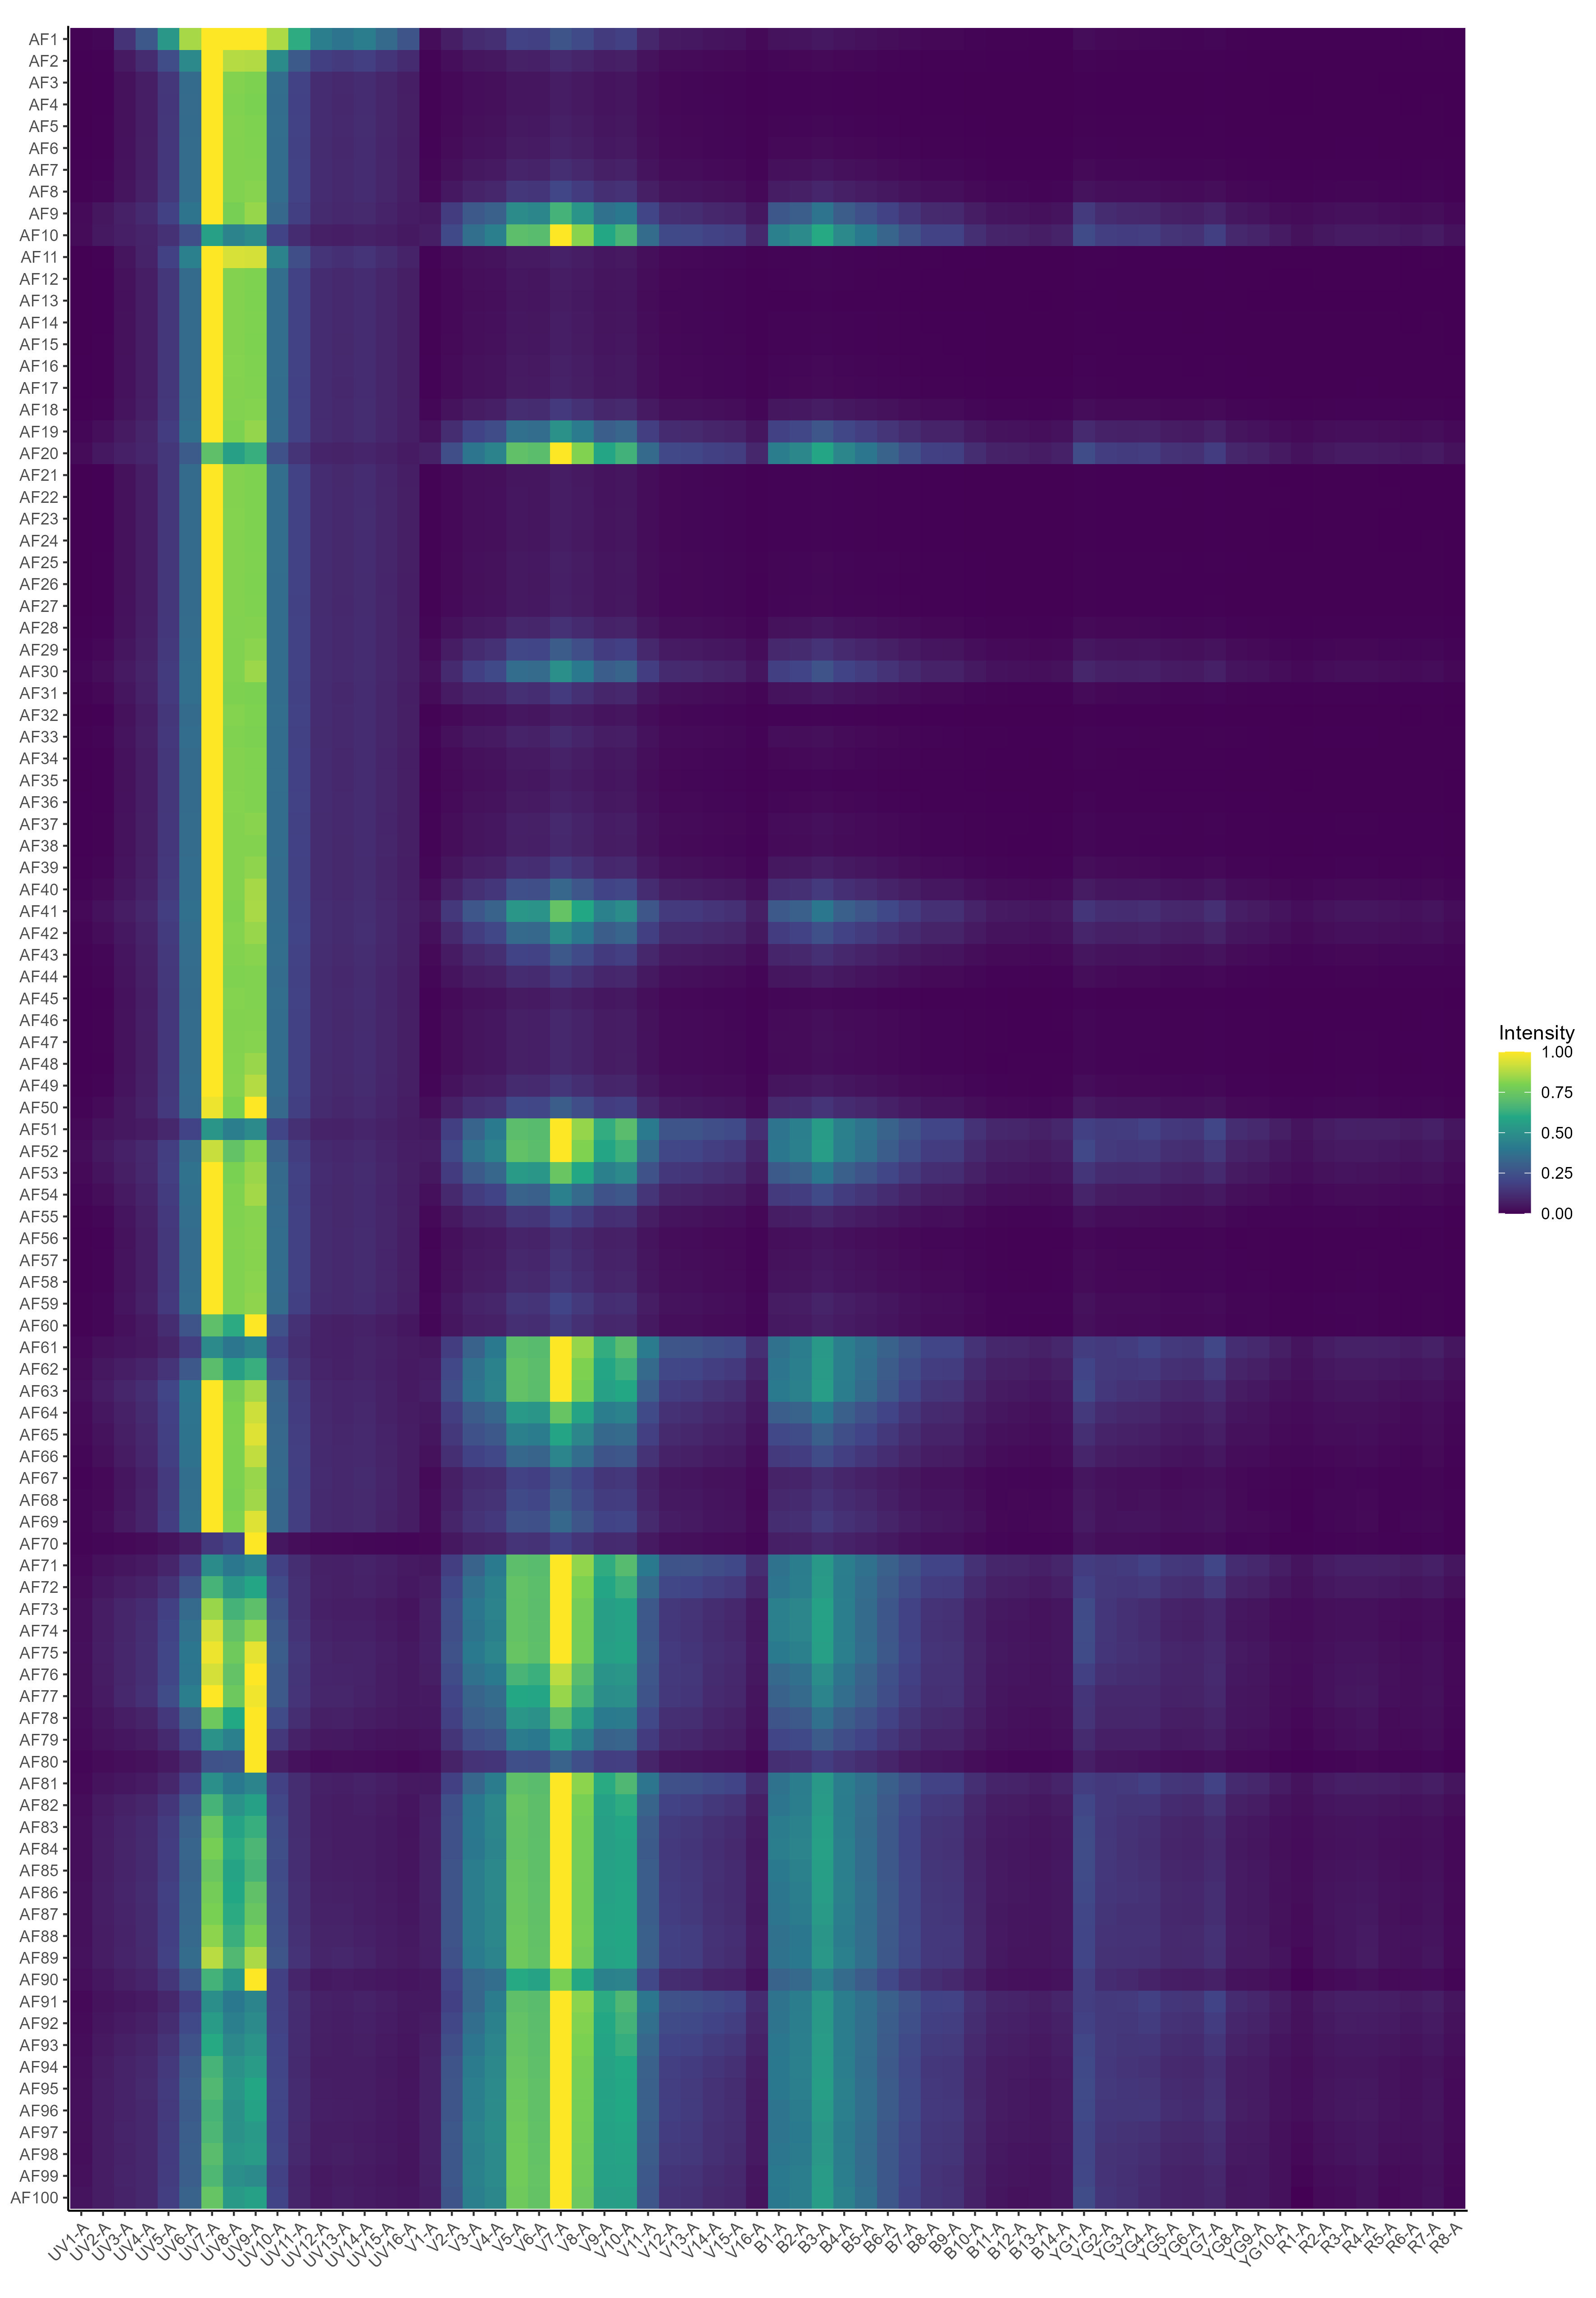
There’s also a heatmap generated, but I don’t find this so useful. If you want, you can probably create some nicer looking plots with some metaclustering or a dendrogram to group the AF signatures. We don’t use metaclustering on the SOM nodes because this gives slightly inferior results in the unmixing.
Okay, now we’re ready to unmix with per-cell AF extraction.
If you are working with multiple sources like in this example, be
sure to provide the corresponding AF for the unmixing. For example, for
lung cells, provide the lung AF spectra. If you provide a non-matching
AF, it won’t create problems (based on both theory and empirical
testing), but the results will not be as good as if a matching one were
used, simply because the best match won’t be present for all cells. Note
that this means you can use pooled samples as long as you have enough
events acquired, although you may need to increase som.dim
if there are a lot of AF signatures present in each part of the
pool.
While you can call unmix.autospectral directly, this
requires reading in the FCS file into R, extracting the expression data
and so on. The better option is to just call unmix.fcs directly, which
will create an unmixed FCS file from your raw FCS file.
fully.stained.dir <- "./Fully stained"

unmix.fcs( fcs.file = file.path( fully.stained.dir, "C3 Lung_GFP_003_Samples.fcs" ),
           spectra = spectra,
           asp = asp,
           flow.control = flow.control,
           method = "AutoSpectral",
           af.spectra = lung.af,
           weighted = FALSE )
This will use OLS to find the optimal AF per cell. To use WLS, set
weighted = TRUE.
Alternatively, we can call method = "Automatic", which
is the default. This takes care of the decision making for AF extraction
and weighting automatically. So, if you provide af.spectra,
per-cell AF extraction will be done. Weighting will be used if the data
come from the ID7000, the FACSDiscoverS8 or the FACSDiscoverA8,
attempting to replicate the methodology used on those systems. For
explicit control, call method = "AutoSpectral" as above,
and set the arguments.
unmix.fcs( file.path( fully.stained.dir, "C3 Lung_GFP_003_Samples.fcs" ),
           spectra,
           asp,
           flow.control,
           af.spectra = lung.af )
Unmixed FCS files will appear in folder
./autospectral_unmixed.
Go Faster
Per-cell AF extraction involves unmixing the data once per AF signature provided. Since this is a lot of linear algebra, using an optimized library for linear algebra speeds this process up a lot. We suggest swapping out the default R BLAS and LAPACK dll files for the optimized versions in OpenBLAS (or other even better versions). This is relatively simple to do: https://github.com/david-cortes/R-openblas-in-windows Expect speed ups of ~5x.
Don’t set multiple threads for the BLAS. That will interfere with the parallel processing used in other parts of AutoSpectral and probably other R packages.